
XRP Investors Return to Profitability as Technical Patterns Signal Possible 55% Surge
The majority of XRP token holders have returned to profitable territory, setting the stage for a potential climb to $2.24, though maintaining support above $1.40 remains critical for bulls.

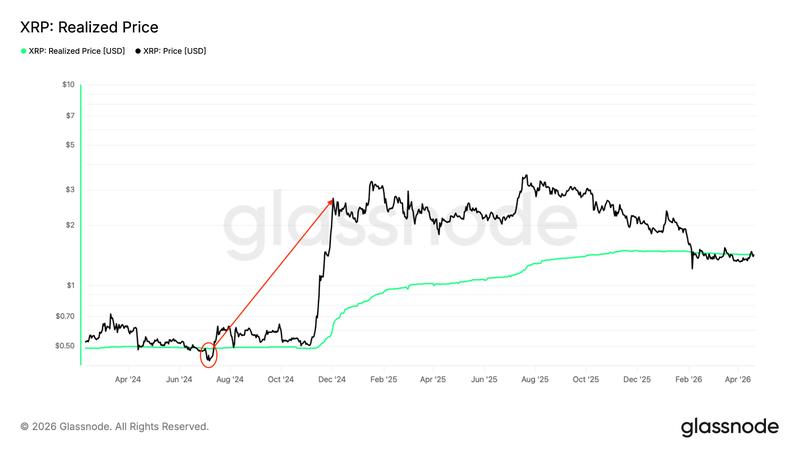
A 28% recovery in XRP's (XRP) price from its macro bottom of $1.12 has lifted it beyond its realized price level. Put differently, the typical XRP investor has exited negative territory.
Does this provide sufficient momentum for bullish traders to drive the digital asset's value to $2.24?
Key takeaways:
- XRP investors have returned to profitability following a reclaim of its realized price at $1.41.
- A symmetrical triangle formation on XRP's chart suggests a 55% surge to $2.40.
XRP maintains position above its cost basis
According to data from TradingView, the XRP/USD trading pair is currently at $1.44, representing a 1.6% increase in the past 24 hours and a 5% gain across the previous seven days.
This indicates XRP is sustaining levels above its realized price, which represents the average acquisition cost of all tokens based on their last transaction, presently standing at $1.41, per Glassnode data.
The return to profitability for the average XRP investor after experiencing unrealized losses delivers significant financial relief to numerous holders, indicating a bullish perspective.
Throughout XRP's trading history, surpassing this threshold has transformed market sentiment away from "fear," diminishing selling pressure from holders experiencing losses and promoting retention.
The data visualization below demonstrates that when the price recaptured its realized price following several months of trading beneath it during mid-2024, it surged 460% to reach $2.90 from $0.52.
Maintaining support above $1.40 is essential for bullish traders to secure a potential upward breakthrough.
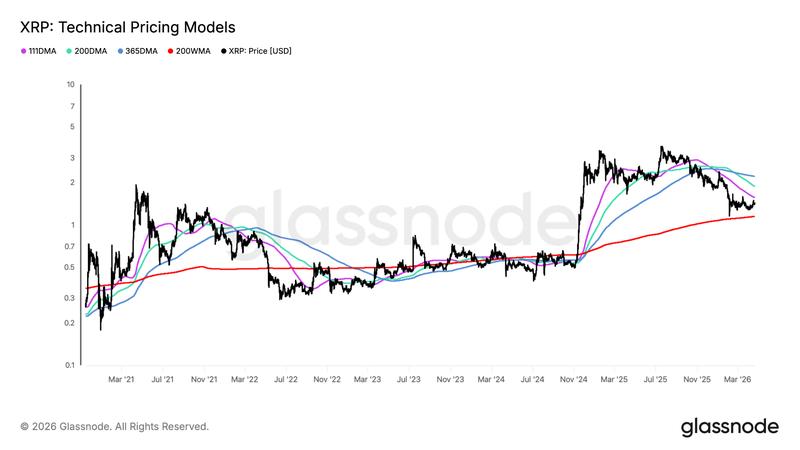
Looking at resistance levels above, the critical price zones to monitor include the 111-day moving average (MA) positioned at $1.57, the 200-day MA located at $1.88 and the 365-day MA sitting at $2.22, according to XRP's technical pricing model.
Symmetrical triangle formation on XRP points to $2.40 target
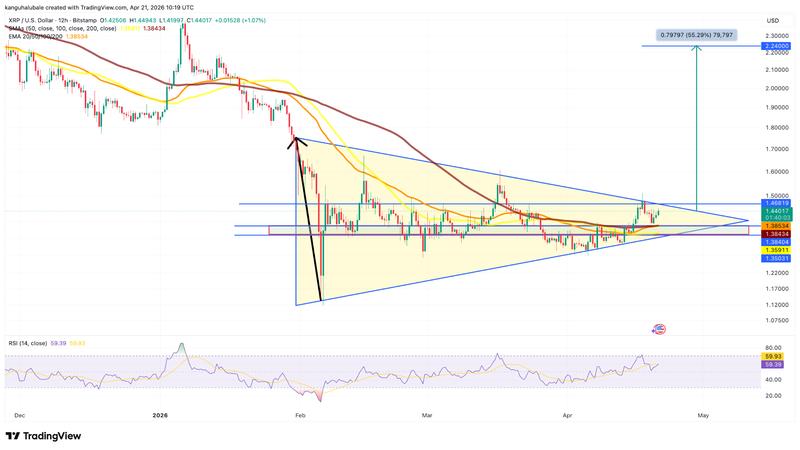
XRP has been trading within the confines of a symmetrical triangle pattern for over two months, as illustrated in the chart below.
For the XRP/USD pair to maintain its upward momentum, it must breach and secure a close above the triangle's upper trend line positioned at $1.46.
The pattern's projected target, determined by adding the triangle's vertical height to the breakout level, stands at $2.24, representing a 55% increase from current levels.
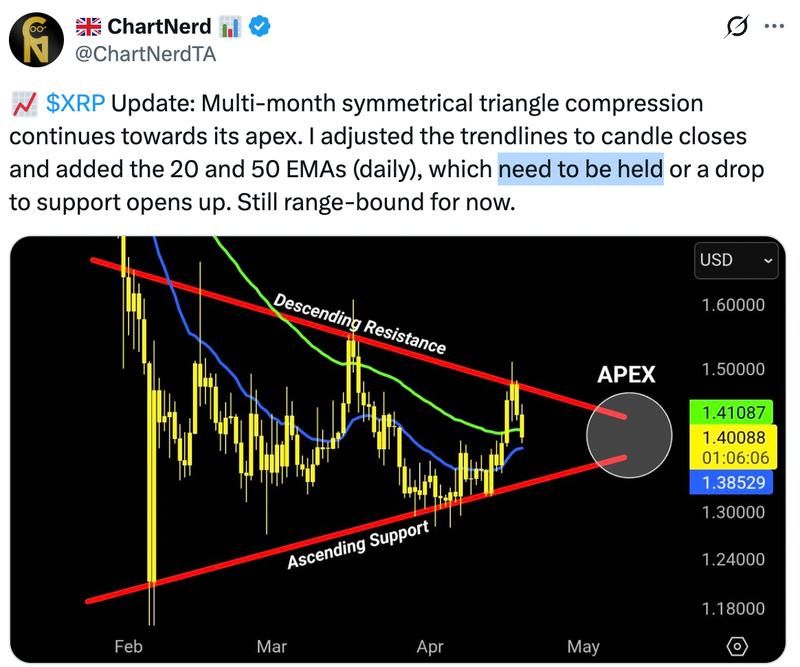
ChartNerd, a technical analyst and trader, stated that the moving averages ranging between $1.35 and $1.40 "need to be held" to preserve the bullish scenario.
According to a previous Cointelegraph report, purchasing activity will need to secure a daily candlestick close above the upper trendline of a descending parallel channel located at $1.60 to validate a possible trend reversal.