
Bitcoin Poised for 'Fresh Peaks': Five Key Developments to Monitor This Week
Despite escalating tensions between the US and Iran, Bitcoin managed a positive weekly close, with analysts predicting BTC will surpass the recent local peaks established last week.

As Bitcoin (BTC) enters the final complete trading week of April, it faces dual challenges of escalating geopolitical tensions involving the US and Iran while confronting significant resistance barriers ahead.
Key points:
- Bitcoin maintains positive momentum across weekly timeframes with several critical price targets in close proximity.
- Elliott Wave technical analysis identifies $81,000 as the next crucial resistance hurdle for Bitcoin bulls to overcome.
- Renewed escalation in US-Iran conflict poses risks to recent gains across cryptocurrency and broader risk assets.
- Bitcoin ETFs registered substantial inflows, though the average investor entry point remains above the $80,000 mark.
- Analysis of Bitcoin's true market mean indicator suggests the ongoing bear market continues to exhibit relatively "mild" characteristics.
BTC price action capable of reaching "new highs" in coming days
Despite late-session selling pressure that pushed Bitcoin below the $74,000 threshold, the leading cryptocurrency successfully recorded a positive weekly candle close.
According to data sourced from TradingView, a moderate price recovery has commenced as the new trading week gets underway — this comes even as geopolitical escalation risks between the US, Israel and Iran continue to cast a shadow over markets.
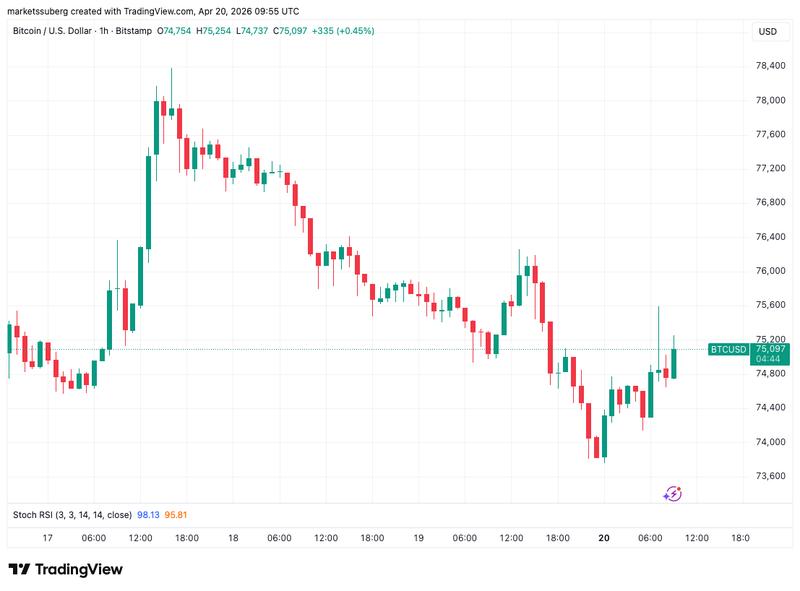
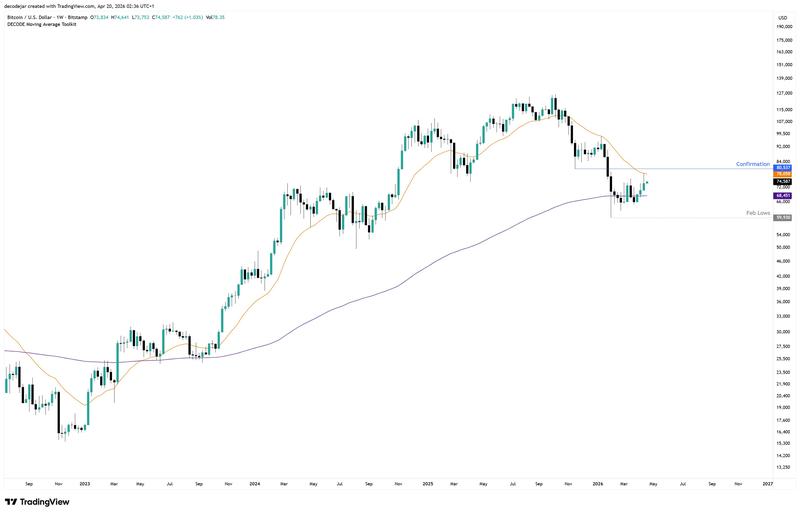
The current price structure reveals several resistance barriers positioned above, with the most immediate challenge being the 21-week exponential moving average (EMA) situated at $78,400.
During weekend trading activity, prominent trader and market analyst Rekt Capital highlighted the critical importance of this particular trend line for price trajectory.
"Bitcoin is rejecting from the 21-week EMA (green)," the analyst observed in a post shared on X, accompanied by an image of the weekly timeframe chart.
"It is this rejection that could force a post-breakout retest of the top of the Double Bottom (~$73k) next week, provided Bitcoin Weekly Closes just like this."
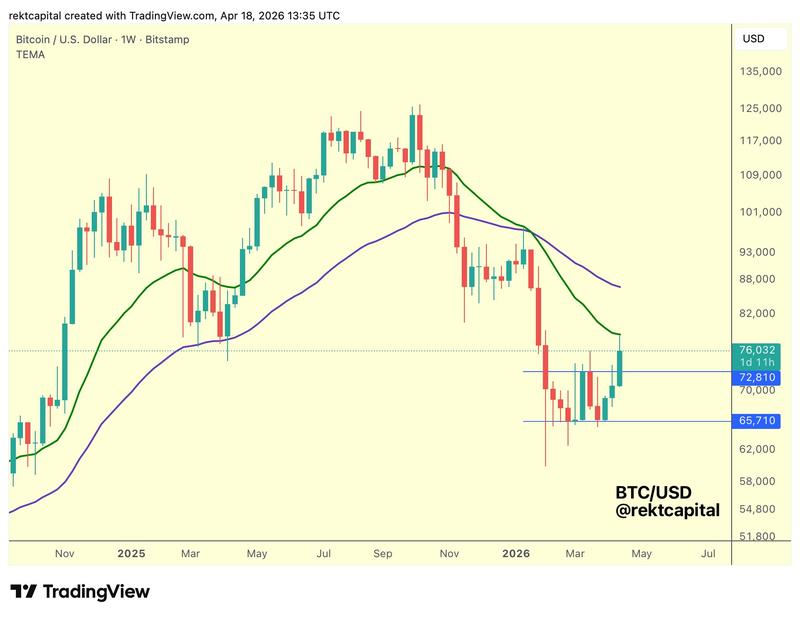
In a follow-up analysis, Rekt Capital explained that successfully retesting the $73,000 zone would serve to "confirm the breakout" from a bullish perspective.
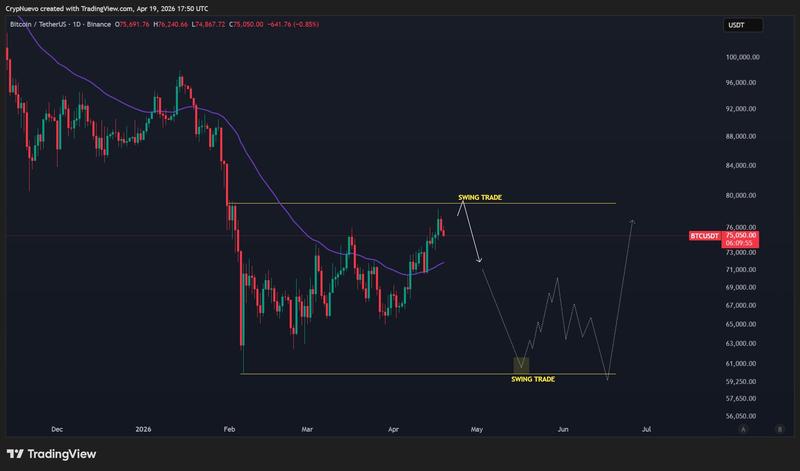
Meanwhile, trader CrypNuevo projected that BTC/USD would likely remain confined within a trading range capped at $80,000 "for the next month." The analyst acknowledged that potential upside remains "unknown" should tensions between the US and Iran reach a definitive resolution.
Cryptocurrency analyst Michaël van de Poppe, by contrast, maintained an optimistic outlook, anticipating a move above the previous week's local peak values. He observed that a fresh "gap" has formed above current price levels in CME Group's Bitcoin futures marketplace.
"Relatively strong bounce upwards on $BTC on Monday, as markets tend to go risk-off prior to the open. Gold has gone down, so no attached risk," the analyst communicated to his X audience on Monday.
"Bitcoin bouncing upwards, and given that there's still a gap to $77.3K, I would assume we're going to see new highs this week."
$81,000 identified as Bitcoin's critical "final boss" resistance
In its most recent BTC price evaluation, cryptocurrency market intelligence platform Decode highlighted $81,000 as the pivotal resistance threshold that must be conquered.
Utilizing Elliott Wave analytical methodology, Decode demonstrated BTC/USD currently trading within the range bounded by the 200-week and 21-week EMAs.
"Bitcoin still pinned below the 21 week ema, but looking pretty good overall, and with the final boss at 81k," the platform stated.
This "final boss" level, Decode elaborated in subsequent discussions on X, "narrows the options from an Elliott Wave perspective, removing short term bearish counts."
The $81,000 level additionally corresponds to the mean entry price for institutional participants in the US spot Bitcoin exchange-traded funds (ETFs).
In close proximity, the cost basis for Bitcoin's short-term holders (STHs) — market participants holding positions for up to six months without liquidating — currently stands at $83,500, according to information from blockchain analytics provider CryptoQuant.
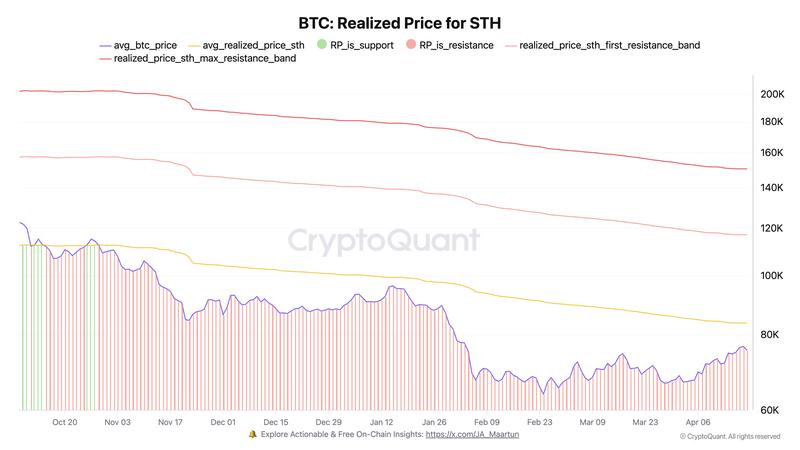
CryptoQuant observes that the STH spent output profit ratio (SOPR) metric — which measures the proportion of STH coins transacting onchain at either profit or loss — is hovering around the breakeven point.
"If SOPR manages to sustainably move back above 1, it would indicate that STHs are once again realizing profits, which is generally positive for the market as long as values do not become excessive," analyst Darkfost explained in a "QuickTake" blog entry published last week.
Renewed Iran conflict threatens to reverse risk-asset rally
The upcoming week features limited macroeconomic data releases from the US, however market participants are focused on more pressing developments.
With the unexpected resurgence of hostilities involving the US and Iran, market participants are revisiting scenarios involving elevated oil prices and their potential longer-term inflationary consequences.
"And it appears that intensifying hostilities could unwind the bullish action over the past few weeks."
WTI crude oil prices declined to their weakest levels since the beginning of March during the previous week as market participants increasingly anticipated that ceasefire arrangements and diplomatic agreements between the US and Iran would hold firm. The recent breakdown in diplomatic efforts triggered a price rebound approaching $90 per barrel.
S&P 500 futures contracts managed to avoid significant correction at the start of the new week, declining approximately 0.6% during Monday's session.
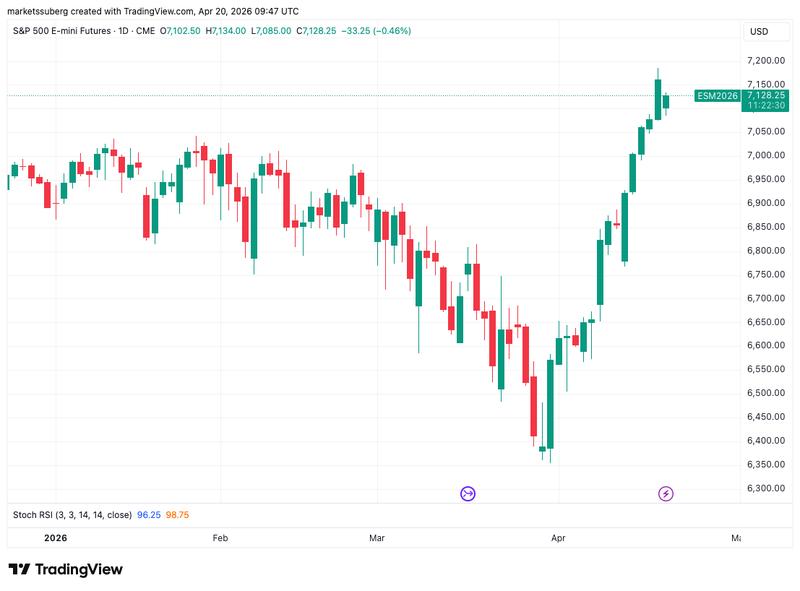
Furthermore, Mosaic cautioned that warning signals had already emerged regarding the sustainability of the equities rally following the S&P's climb to record all-time highs.
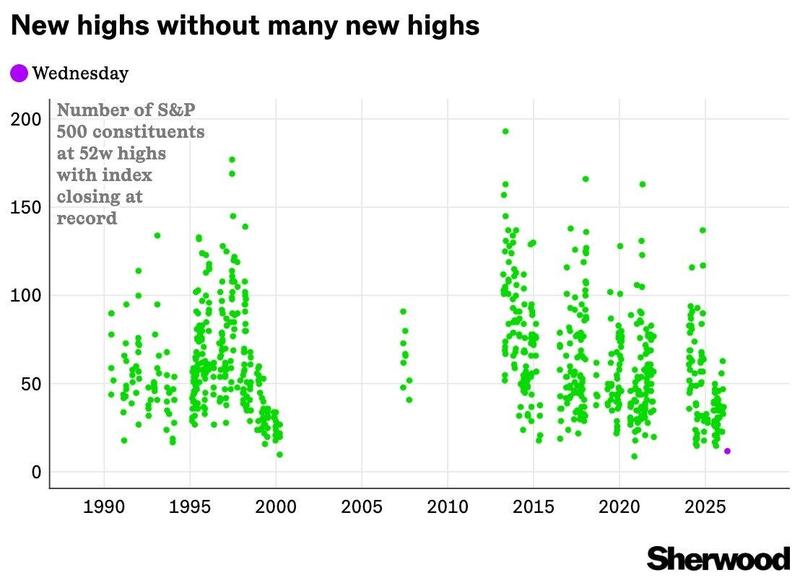
"Simply following breadth, sentiment, and positioning by institutional investors helped flag the recent rally. At the same time, warning signs were already emerging as the S&P 500 broke out to record highs," the firm noted.
"The number of stocks breaking out to new highs is failing [to] confirm the move in the indexes, while buying pressure from a key group of institutional investors has largely run its course."
As previously covered by Cointelegraph, crude oil pricing has come under particular scrutiny as a potential driver of US inflation trends. The forthcoming Consumer Price Index (CPI) release, which will capture the war's ongoing influence throughout April, is scheduled for publication on May 12.
Institutional investors embrace risk-on positioning in Bitcoin
The surge in risk appetite stemming from Iran-related optimism produced an immediate effect on institutional Bitcoin investment products.
Specifically, the US spot Bitcoin ETFs recorded notable capital inflows extending through Friday, with more than 25,000 BTC flowing into these products across the five-day period.
"The latest accumulations by spot ETF firms are significant, as the last time they posted a figure this close was in April 2025, when they added 23,900 units," CryptoQuant highlighted in a "QuickTake" analysis piece addressing this development.
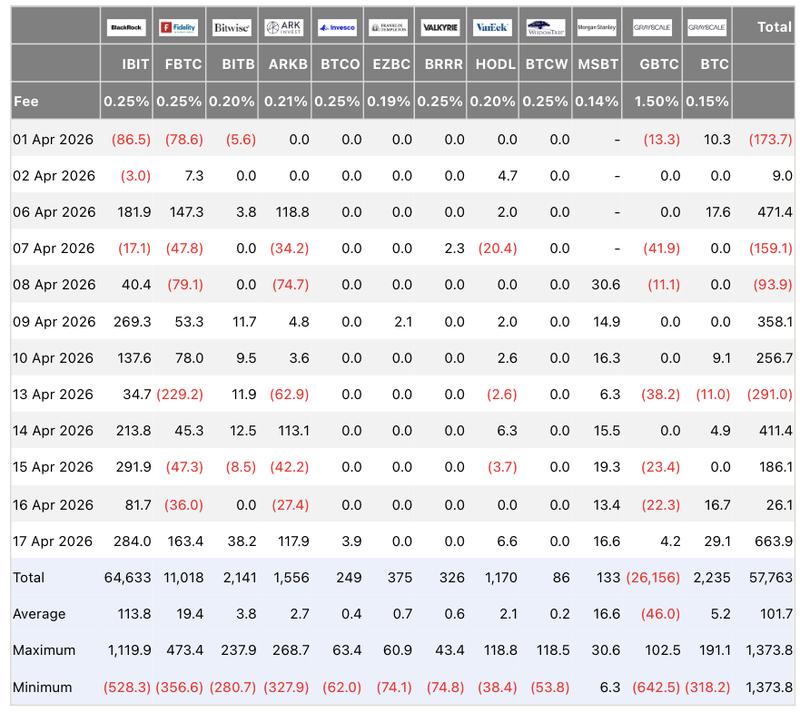
Information compiled by UK-based investment firm Farside Investors verifies that Friday's trading session alone witnessed net inflows to the ETF products exceeding $660 million — marking the largest single-day accumulation since January.
"Aside from the current milestone, BTC spot ETFs are recovering," CryptoQuant added.
"The balance held by the firm offering them has been declining since October, but has risen since the February dip."
Measured in BTC terms, the aggregate holdings across all ETFs have reached their highest point since November 2025.
In commentary shared on X, Andre Dragosch, European head of research at digital asset manager Bitwise, recognized that the average ETF investor cost basis remains positioned above current spot price at $81,000, amplifying the psychological importance of that price level as a resistance obstacle.
Bitcoin downside trajectory continues along "milder path" historically
The typical Bitcoin holder continues to hold underwater positions despite the recent advance to ten-week peak levels for BTC/USD.
Fresh analysis from blockchain analytics platform Glassnode additionally cautions that when evaluated against historical precedents, Bitcoin's present bear-market drawdown continues to exhibit "mild" characteristics.
In an X analysis article released on Thursday, principal analyst CryptoVizArt employed the true market mean (TMM) indicator to evaluate holder profitability levels. TMM methodology filters out coins that have remained dormant for extended periods or have been lost, thereby delivering a more precise representation of cost basis for the actively circulating BTC supply.
"When BTC trades below TMM, the average active holder is underwater. Since 2016, this has happened ten times with meaningful negative outcomes — episodes lasting from 2 days to over 11 months, with max drawdowns ranging from -0.1% to -57%," the analyst summarized.
Bitcoin has now extended beyond 75 days into its current sub-TMM trading phase, with the TMM indicator itself positioned at $78,200.
A comparative chart plotting 2026 performance against Bitcoin's historical average periods below TMM reveals the current price action following a "milder path" relative to previous cycles.
"That said, 75 days is still early. The 2018 and 2022 episodes didn't bottom until months 5-9," CryptoVizArt cautioned.
"The signal isn't 'all clear' — it's 'watch closely.' Reclaiming the TMM and stabilizing there would mark active investors returning to profit, historically a strong reset point for momentum."