BTC and Technology Equities Recover Despite Nvidia Turbulence, $68K Level in Focus
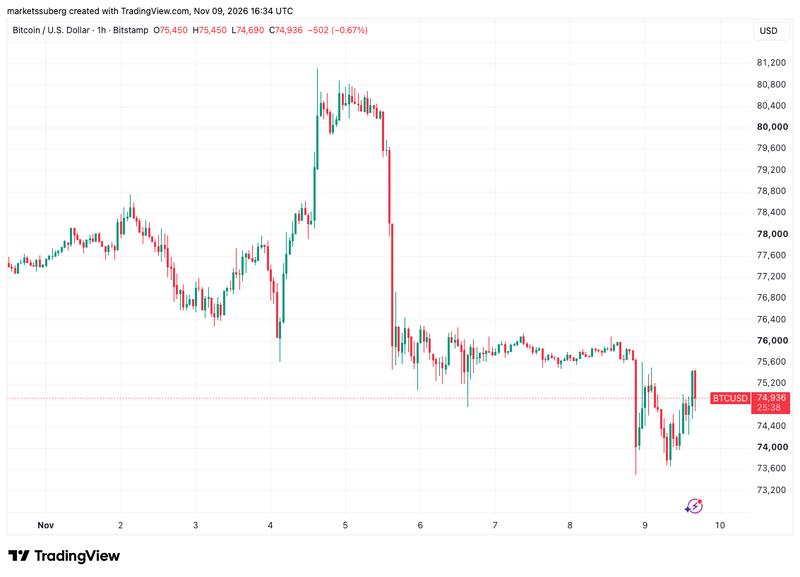
The leading cryptocurrency bounced back from its lowest point in 11 weeks around $73,500 while the Nasdaq Composite advanced despite a downturn in Nvidia stock.

Following the opening bell on Wall Street Monday, Bitcoin (BTC) climbed back above the $75,000 threshold as technology equities staged a recovery.
Key points:
- The flagship cryptocurrency rebounded from its lowest levels in 11 weeks at $73,500 on Monday as market participants increased their exposure to technology stocks.
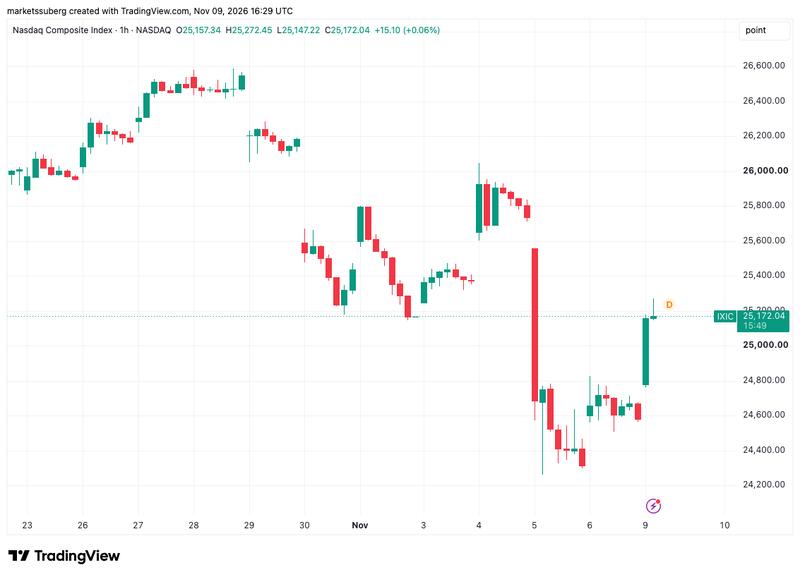
- Equity markets recovered from the controversy involving Nvidia CEO Jensen Huang, with the Nasdaq Composite Index climbing as much as 2.6% during Monday's session.
- Technical analysis of BTC price action suggested the possibility of a decline toward the 200-week simple moving average trendline situated at $67,755.
Cryptocurrency and equities overcome Nvidia concerns
Information from TradingView revealed BTC/USD trading 0.8% higher after touching lows of $73,500 on Sunday, marking a price level last observed on Aug. 21.
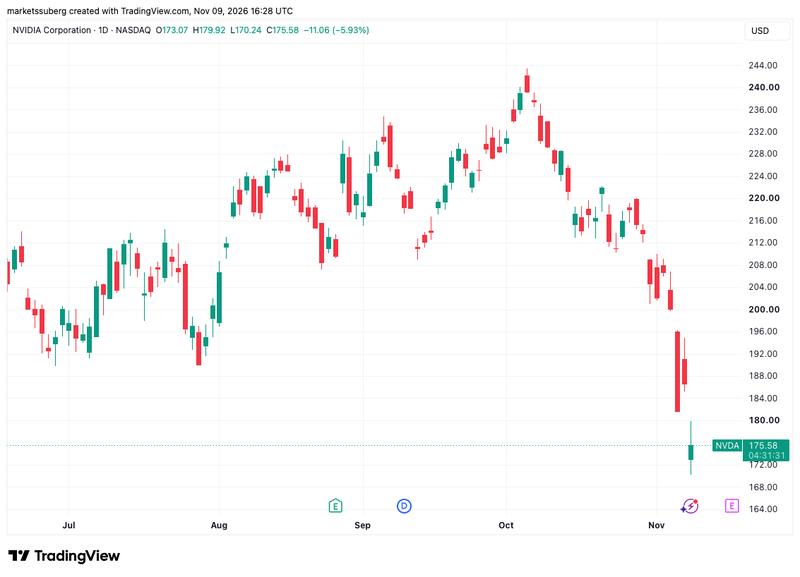
The downturn came alongside reports suggesting that Nvidia CEO Jensen Huang might have been targeted by Chinese intelligence operations, allegations that Beijing later refuted. Shares of Nvidia dropped approximately 6% to $170.24 during early Monday trading, representing a price point last seen on March 31, before recovering to intraday peaks of $179.92.
In commentary shared on Sunday, Dan Ives, senior managing director at merchant bank Yorkville Ives & Co., cautioned that the situation could generate sustained pressure on Nvidia's equity valuation.
This is a black eye moment for Jensen and will spark multiple congressional inquiries at a minimum and will create an overhang on the stock for a myriad of reasons.
Dan Ives, Yorkville Ives & Co., via CNBC
Gary Gensler, former chair of the US Securities and Exchange Commission (SEC), said that Nvidia's board would face "tough choices" based on the results of the company's internal investigation.
Meanwhile, market participants moved to purchase technology stocks at discounted prices, with the technology-focused Nasdaq Composite Index overcoming the Nvidia allegations to advance 2.5% within the opening hour of US market trading.
Declining crude oil valuations contributed to rekindled momentum in equity markets and provided Bitcoin with relief from its downward pressure. US WTI crude declined to $86.19 per barrel during the session, representing its weakest level since Sep. 1, before bouncing back to approximately $88.20.
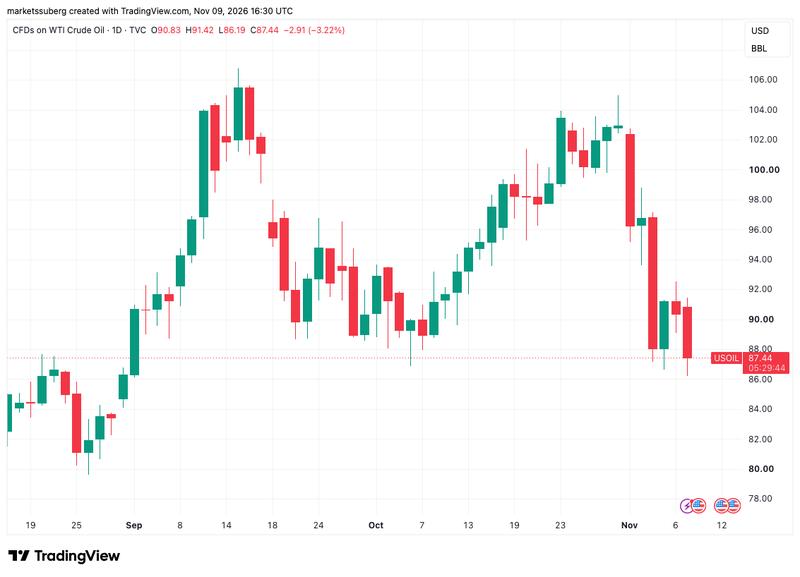
In his most recent market assessment, economist Robin Brooks emphasized the inverse correlation between oil and gold, Bitcoin and the S&P 500 following the attack on Saudi Arabia's East-West Pipeline, a key oil-transit route, in September.
Even if these correlations fade somewhat going forward, it's reasonable to think that a fall in oil prices will lift these risk assets.
Robin Brooks, economist
Bitcoin price action sees potential $68,000 level emerge
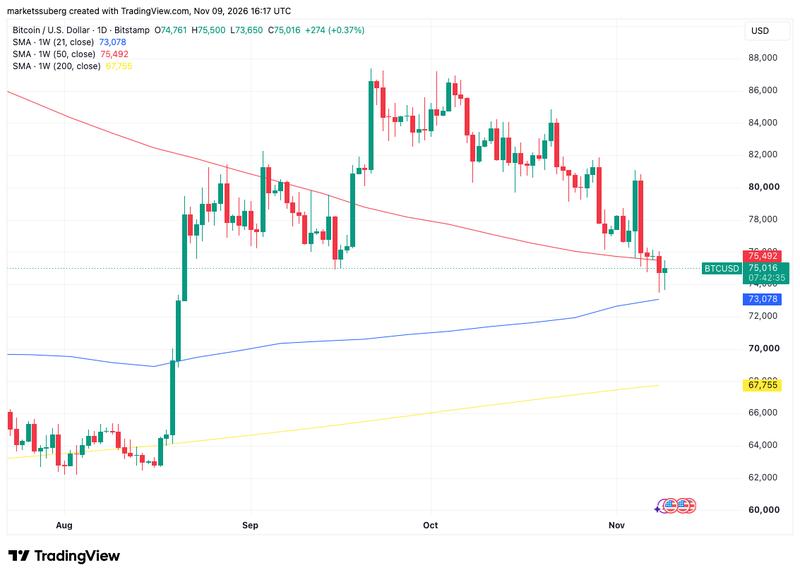
On Monday, BTC/USD traded within a constrained range bounded by its 21-week and 50-week simple moving averages (SMA), positioned at $73,078 and $75,492, respectively.
Analyzing the present market framework, Keith Alan, cofounder of crypto trading platform Material Indicators, identified the possibility of a retreat toward the 200-week SMA at $67,755, a trendline that most recently intersected with price action during mid-August. Simultaneously, Alan observed that conditions were gradually beginning to show improvement on weekly timeframes.
The macro structure and thin order books leave room for lower prices before a breakout can be validated. That test is possible, not inevitable - and it doesn't have to happen this week. In fact, the weekly view is starting to lean bullish.
Keith Alan, Material Indicators
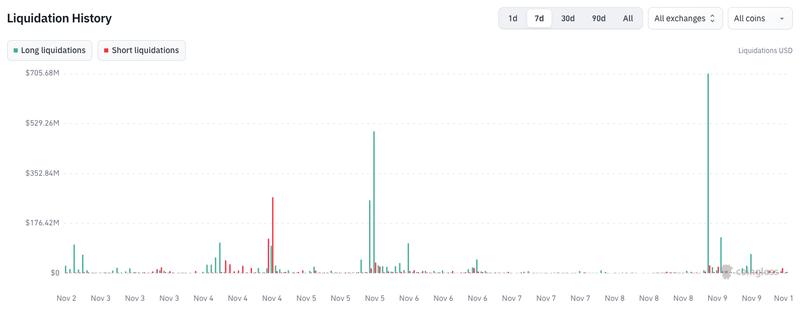
Liquidations across cryptocurrency markets continued at heightened levels throughout Monday's first half, with CoinGlass data showing the 24-hour aggregate reaching $1.2 billion as of 5pm UTC.