
Bitcoin's Potential Path as Nasdaq Correction Deepens
BTC maintains crucial long-term support levels, setting sights on $92,630 target as the Nasdaq shows signs of extended correction potential.

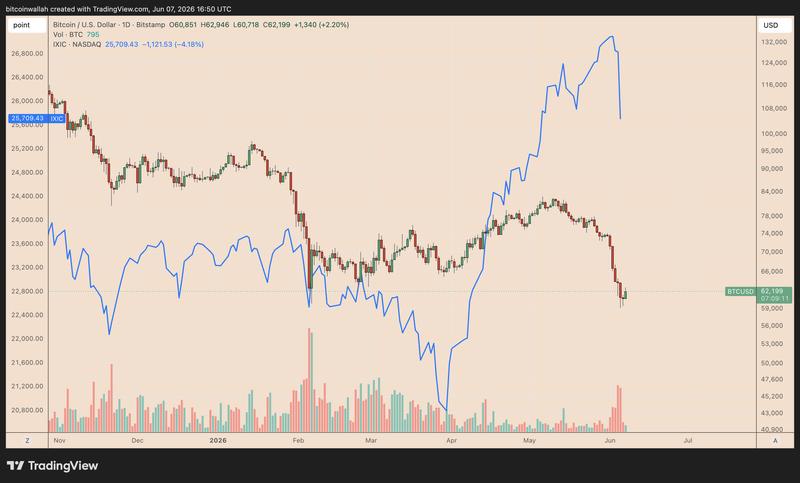
According to Bitcoin (BTC) market observers, the cryptocurrency's ability to maintain levels above the psychologically significant $60,000 mark throughout the weekend proved crucial, as the digital asset climbed 6.5% from its local bottom around $59,100 to reach an intraday peak of approximately $62,950 during Sunday's trading session.
Key takeaways:
- Bitcoin targets a potential advance to $92,630 provided it sustains its position above a critical moving-average support level.
- Technical indicators for the Nasdaq suggest a possible short-term decline exceeding 10%.
Bitcoin could surpass $90,000 amid Nasdaq weakness
The recovery in Bitcoin emerged as particularly notable given that the technology-focused Nasdaq Composite (IXIC) experienced a decline exceeding 4% during Friday's session, marking its most significant single-day loss since April 2025. This development has sparked optimism that investment capital might flow back into Bitcoin trading venues.
Technical analysis provided by seasoned market analyst Filbfilb delivered encouraging signals for those bullish on Bitcoin's prospects.
In commentary published Sunday, the analyst drew attention to Bitcoin's resilient performance above its 200-week simple moving average (200-week SMA, represented by the blue line) positioned at approximately $61,880. This particular level has historically served as the foundation for market bottoms in 2020, 2018, and 2015.
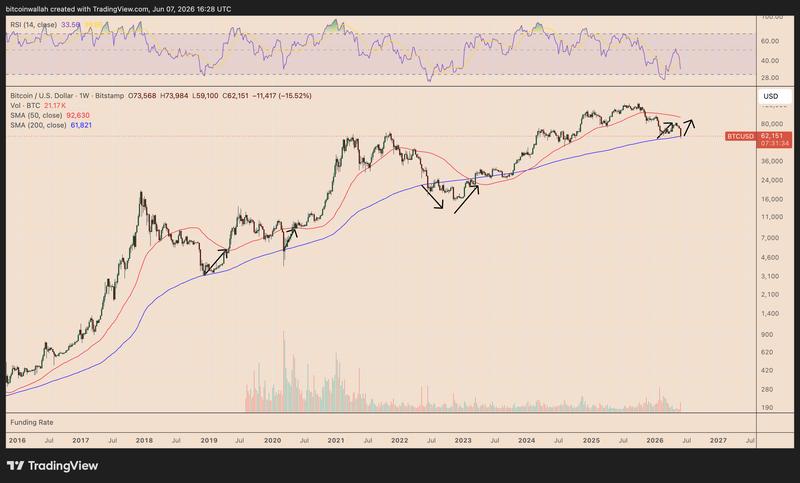
Put differently, market participants might interpret the brief descent below $60,000 as a temporary liquidation event provided that BTC maintains its position above the 200-week SMA, with the 50-week SMA (displayed in red) positioned near $92,630 emerging as the subsequent significant resistance target on the upside.
Simultaneously, the Nasdaq appears to be undergoing a correction phase toward its 20-week SMA, indicated by the green line near 22,905 points, following a decline in its weekly relative strength index (RSI) to 62.46 from approximately 74.75.
Historical patterns since 2021 show that each significant Nasdaq weekly RSI decline from overbought territory above 70 to levels below 70 has resulted in the index retreating toward its 20-week moving average.
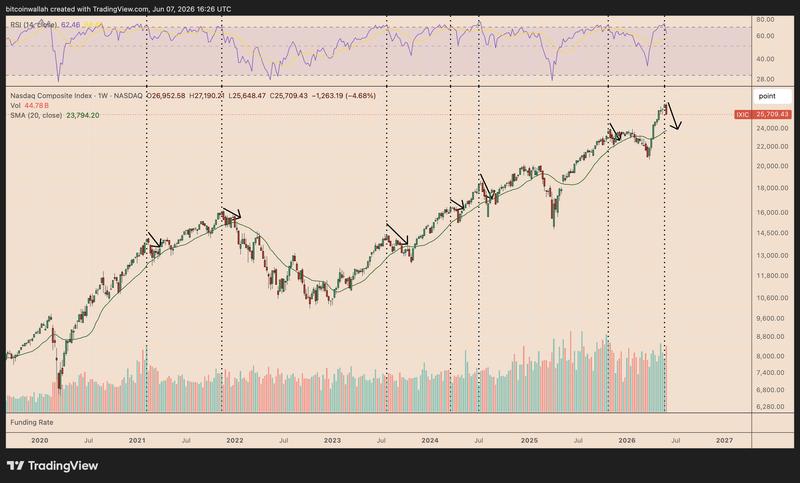
Should this historical pattern repeat itself, the Nasdaq could decline toward the 22,905 level, which would represent an additional decrease of approximately 10.75% from its present price point during June or extending into July.
Having said that, Bitcoin may be positioning itself for a pronounced mean-reversion rally provided it successfully maintains its long-established support floor while the Nasdaq experiences continued cooling.
BTC rebound scenario gains support from Bitcoin-Nasdaq ratio
The ratio comparing Bitcoin's performance against the Nasdaq has once again entered historically oversold territory, as indicated by daily RSI measurements.
During Saturday's trading, the RSI declined to 14.70, establishing a new historical low. The prior record stood at 14.88, which was recorded in February, preceding a price recovery in BTC exceeding 30%.
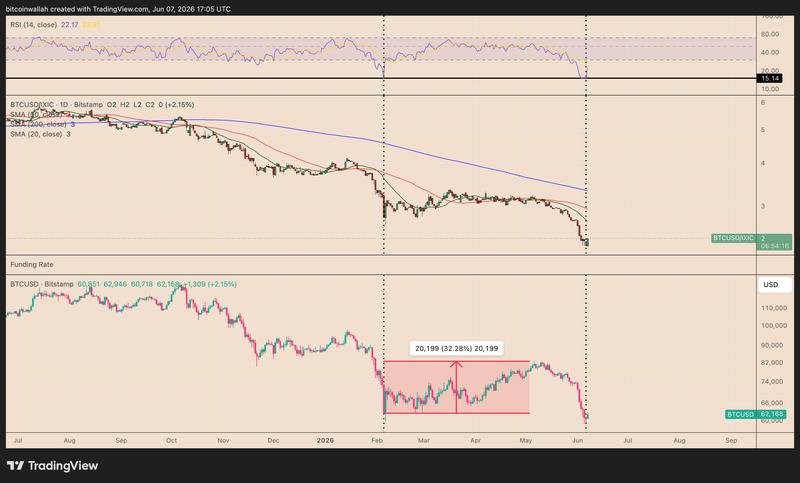
Fundamentally, this indicates that Bitcoin had reached excessively undervalued levels when compared to the Nasdaq, prompting buyers to enter the market. This identical configuration is manifesting once more, reinforcing the possibility of an upward price movement in BTC throughout the upcoming weeks.