Bitcoin Plunges 6% to Seven-Week Bottom as Stock Markets Wipe Out Post-Election Rally
The leading cryptocurrency drops closer to $75,000 amid widespread equity selloff and cryptocurrency market liquidations totaling $500 million in 24-hour period.

The price of Bitcoin (BTC) dropped beneath the $76,000 threshold on Thursday following an abrupt reversal in risk assets that had previously rallied after the US midterm elections.
Key points:
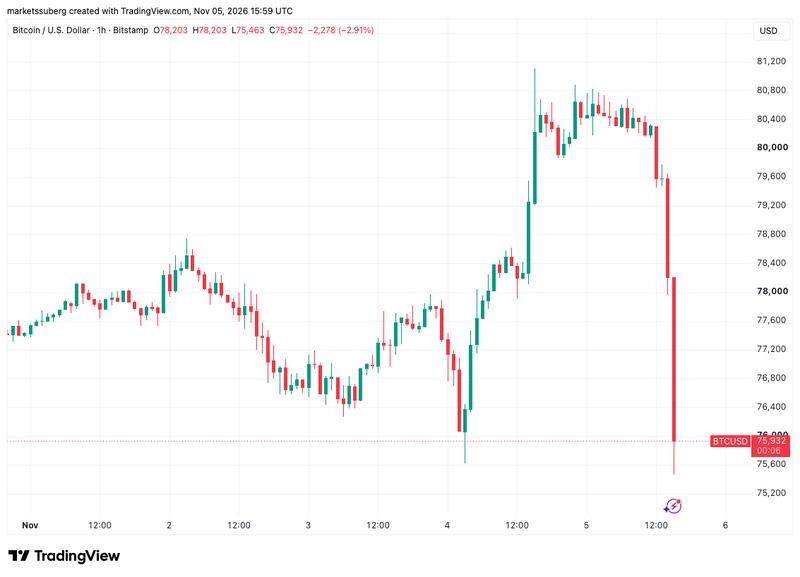
- The cryptocurrency declined to $75,463, marking its weakest performance since Sept. 16, as the stock market selloff intensified.
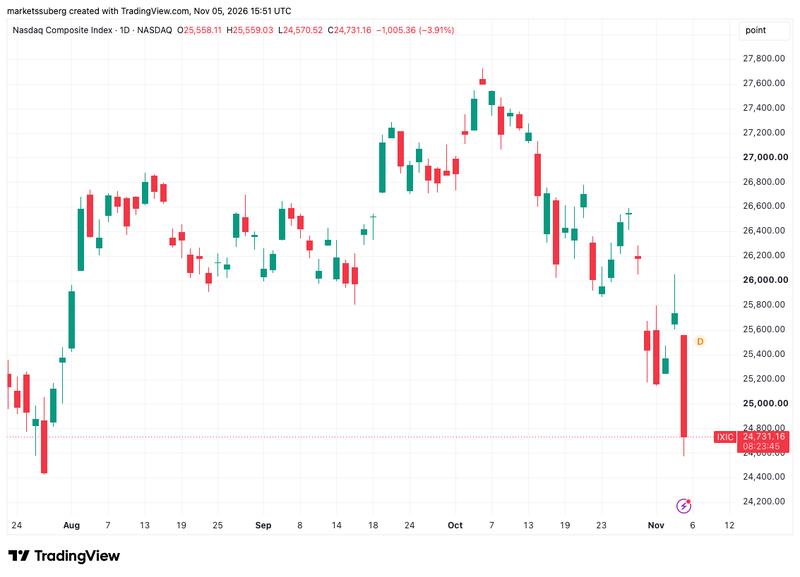
- Assets considered risky surrendered their post-US midterm election profits, with the Nasdaq Composite Index plummeting 4.2%.
- The BTC/USD trading pair momentarily dipped beneath its 50-week simple moving average (SMA), sitting at $75,733, testing the level's capacity to provide support.
BTC price drops under $76,000 during broad risk-asset selloff
Information from TradingView revealed BTC/USD losing over 6% to reach $75,463 on Bitstamp, representing its weakest position since Sept. 16.
Following rapid advances driven by a Democrat victory in both the US House of Representatives and Senate, equity markets experienced aggressive selling on Thursday as market participants rotated away from technology stocks. The S&P 500 declined 2.7%, while the technology-focused Nasdaq Composite Index surrendered more than 4% to reach its weakest point since July 29.
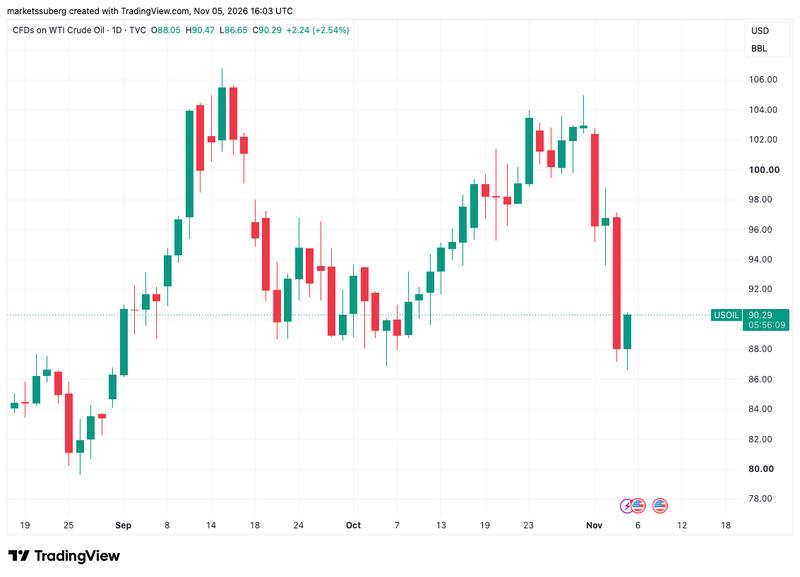
Crude oil prices recovered following news reports of additional strikes targeting tankers in the Middle East and speculation regarding potential Democratic actions to address the US-Iran war. WTI crude climbed back above $90 per barrel, while Brent increased 2.5% to near $97.
"We may be headed for more volatility as investors digest the election results and potential policy implications," Jordan Watson, a portfolio manager at Tandem Investment Advisors, told CNBC. Watson added that equities gains following the midterm results should not be treated as an "all-clear signal."
Earlier, Cointelegraph reported on worries that Democrat policies might prove less supportive to the AI sector, possibly limiting already fragile capital expenditure plans.
Economist Mohamed El-Erian questioned whether the change in US political trajectory would really have a long-term negative impact on the tech sector. "Will the shift in Congress actually slow tech down? If yes (as many assume, though I'm less sure), can the rest of the market and economy thrive without the shield of tech earnings and spending?" he wrote in a blog post.
El-Erian described the day's tech-stock weakness as "not surprising."
Bitcoin 50-week trend line support at risk
Cryptocurrency markets saw nearly $500 million in positions liquidated during the opening hour of the US trading session, according to data from CoinGlass, with cumulative 24-hour liquidations approaching $850 million at the time of writing.
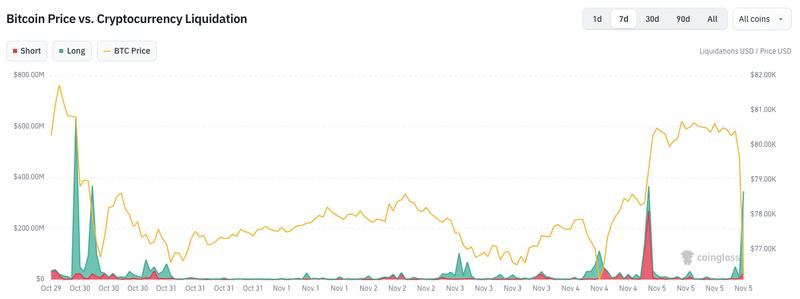
With $76,000 now in its sights, BTC/USD moved toward the lower boundary of its one-month trading range. The pair faced the possibility of losing support at the 50-week simple moving average (SMA), presently positioned at $75,733.
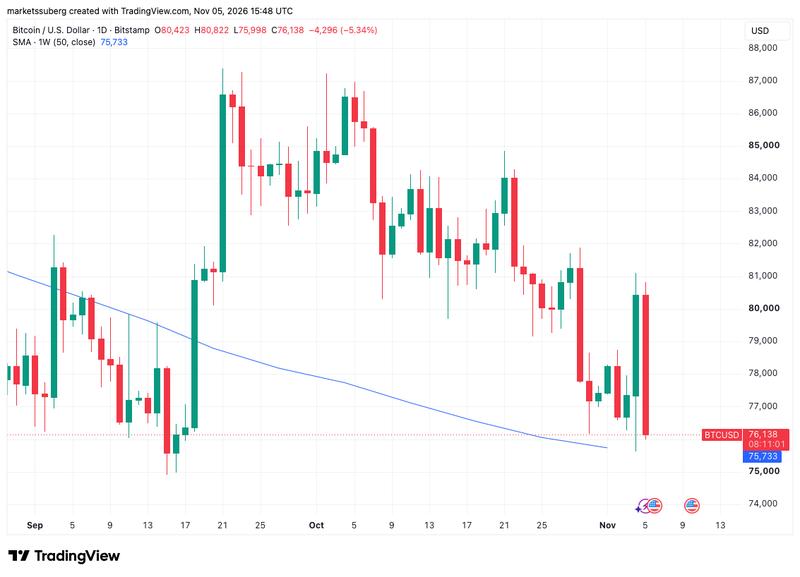
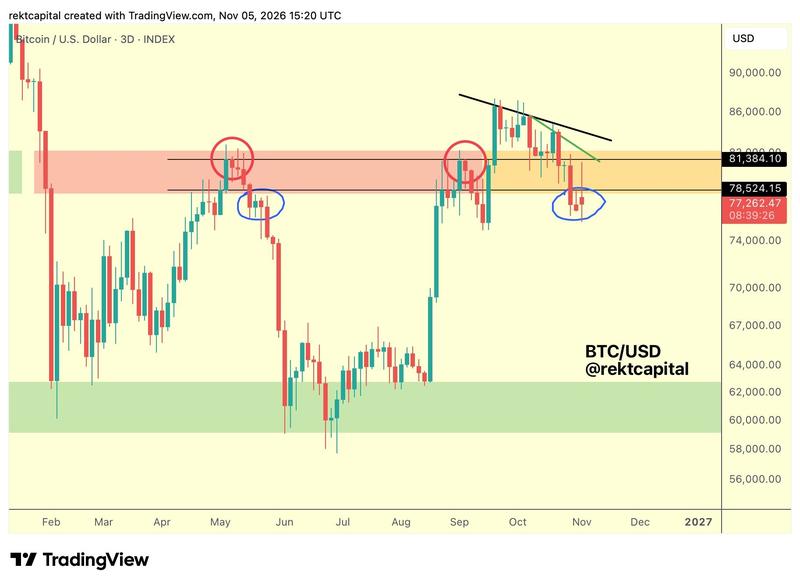
In his latest analysis, crypto trader Rekt Capital noted that Bitcoin was repeating behavior from May, when a period of rangebound moves around $80,000 subsequently gave way to a breakdown and new macro lows of $57,000 in late June.