
XRP Price Analysis Points to Potential $12 Target as Multi-Month Support Zone Remains Intact
After months of consolidation at a critical multi-year support level that has historically sparked significant price surges, XRP could be positioned for a substantial rally to $12, according to market analysts.

According to a monthly price chart presented by crypto analyst MikybullCrypto, XRP (XRP) is currently hovering near a critical long-term support threshold that has previously triggered substantial upward price movements.
Key takeaways:
- From its lowest points in February, XRP has experienced approximately 30% gains.
- Several technical patterns indicate the asset may be forming a bottom, with significant support from robust XRP ETF capital inflows.
Technical analysis suggests XRP could rally to $12
The chart analysis from Milkybull reveals XRP moving within an ascending channel pattern that has defined its price trajectory dating back to 2014. Currently, XRP is positioned near the bottom trendline of this channel in the $1.30–$1.40 range, a historical zone that has served as a springboard for significant bullish movements.
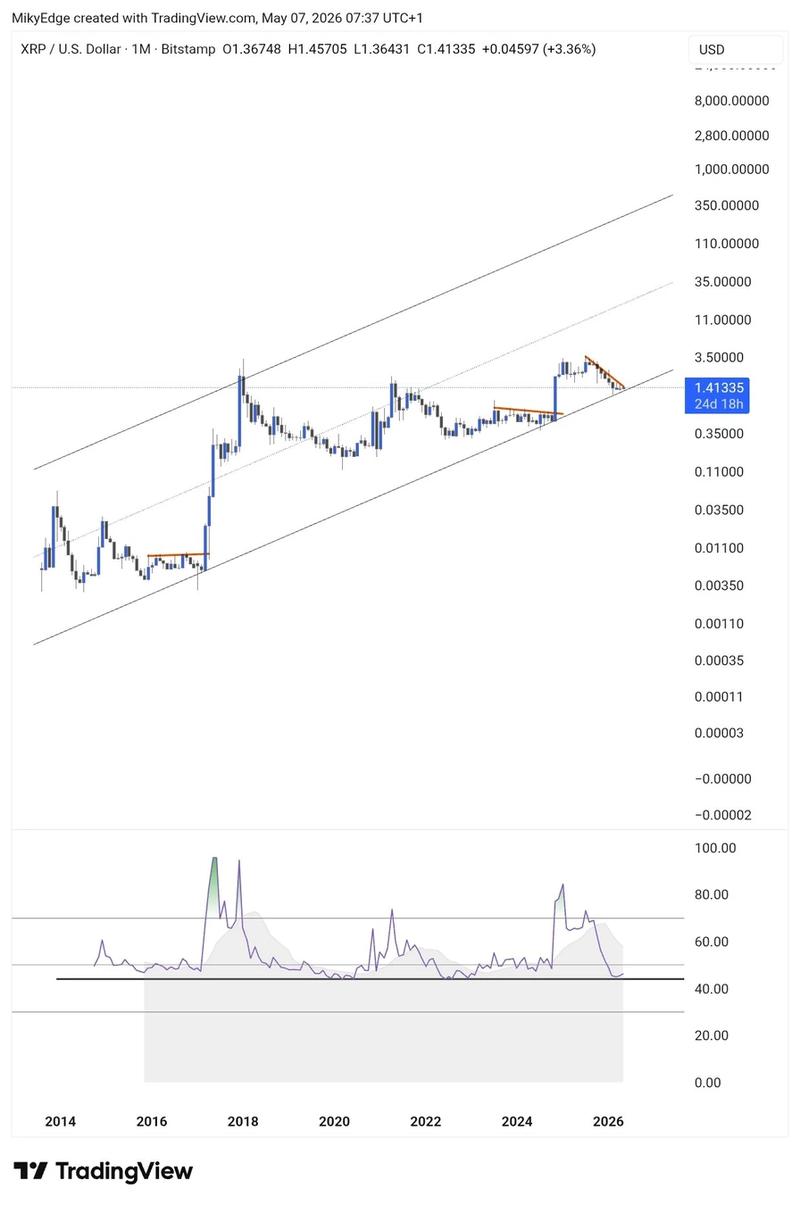
According to the analyst, XRP is "probably going to $12," a price target that corresponds approximately with the middle section of the ascending channel.
Technical momentum indicators provide additional support for the bullish rebound scenario. The monthly relative strength index (RSI) for XRP has declined to a historically supportive region around 40–45, mirroring levels observed before previous significant rallies.
During a post made on Thursday, market analyst JD highlighted the identical RSI support area as a possible indication of a "cycle bottom" for XRP.
The two-week timeframe chart from his analysis demonstrates XRP completing a breakout from a multi-year symmetrical triangle formation, followed by a retracement back to the breakout level.

The projected target area highlighted in green on the chart corresponds to a price range between $8–$14, suggesting substantial upside potential if XRP successfully maintains support at the retest level.
These optimistic price forecasts come after XRP's notable recovery in recent weeks, climbing approximately 30% from its February low point of around $1.11.
Throughout this period, XRP has primarily benefited from a resurgence in risk appetite driven by the US–Iran ceasefire agreement, along with token-specific positive developments.
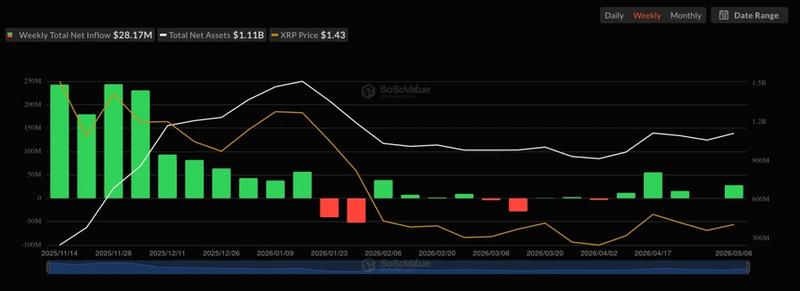
Among these developments are Rakuten Wallet's integration of XRP, which broadened the token's accessibility in Japan, and $81.6 million in cumulative inflows into US spot XRP ETFs during April, representing their most robust monthly performance of 2026.
During the opening week of May, XRP ETFs have already accumulated $28.17 million in fresh inflows.
Bearish scenario could mirror 2022 market downturn
Despite the optimistic technical setup, the bullish case for XRP is far from certain. Bears may attempt to drive the price beneath the channel's supporting trendline. Such a breakdown would negate the constructive technical pattern and expose XRP to potentially significant additional losses.
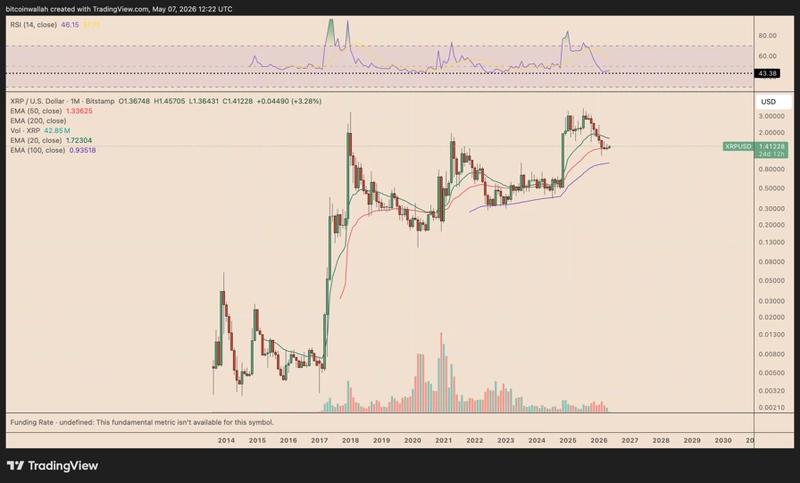
This support zone closely aligns with XRP's 50-month exponential moving average (50-month EMA, the red line) positioned near $1.33.
A decisive break below this confluence of support levels would redirect attention to the 100-month EMA (the purple line) located near $0.93, representing approximately 30% downside from present price levels. XRP experienced a comparable decline throughout the 2022 bear market.