
XRP Technical Indicators Point Toward Potential Rally to $2 Target
Multiple technical and blockchain-based metrics indicate XRP may be positioned for significant upward movement in the coming days.
During the weekend trading session, XRP (XRP) experienced a 9% price increase, climbing to the $1.50 level, as multiple technical and blockchain metrics pointed toward an approaching "full-scale" bullish breakout.
Key takeaways:
- Volatility indicators including funding rates and Bollinger Bands suggest significant price movement ahead for XRP.
- A breakout from XRP's symmetrical triangle pattern indicates a potential move toward $2.05.
Bullish reversal indicators appear for XRP
According to data obtained from TradingView, the XRP/USD trading pair continues to trade 60% beneath its multi-year peak of $3.66 that was achieved in July 2025, while sitting 21% under its yearly opening price of $1.83.
Notwithstanding this significant decline from peak levels, numerous price metrics are pointing toward the possibility of an upward breakout in the near future.
Through examination of XRP's funding rates on the Binance exchange, market analyst Darkfost identified an important bullish indicator, positioning XRP/USD for potential upward momentum.
According to the analyst's recent X platform post, the 30-day cumulative funding rates on Binance have "maintained a bearish bias for nearly three months, even as XRP has posted a 27% gain over the same period," with the analyst further stating:
"When such a strong consensus forms, especially after a correction exceeding 60%, it is often a sign that a potential reversal may be developing."
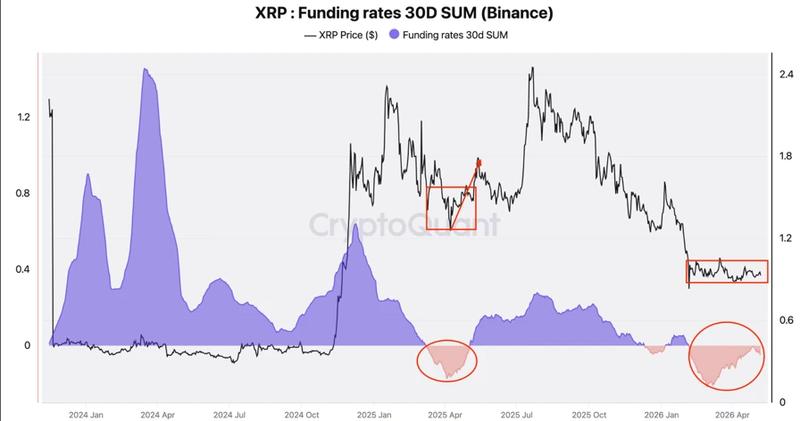
Historical data demonstrates that XRP typically experiences sharp upward moves when funding rates begin recovering following extended periods in negative territory.
A notable example occurred in April 2025, when XRP climbed to the $1.25 level, before what the analyst described as a "bullish recovery eventually triggered a rally that led to a 126% advance."
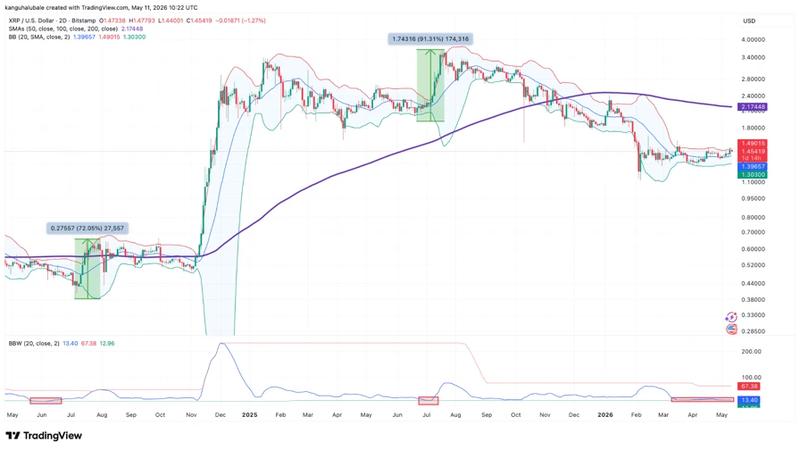
At the same time, the Bollinger Bands technical indicator, which traders utilize to evaluate price momentum and volatility within specific ranges, has contracted to its narrowest point in 10 months, indicating that a substantial price movement may be imminent.
The two-day timeframe XRP Bollinger Bands have contracted to their narrowest configuration since July 2025, as illustrated in the following chart
Following a break above the upper boundary of the Bollinger Bands, the XRP/USD trading pair experienced an approximately 90% surge in July 2025, reaching its multi-year peak at $3.66. During July 2024, the gains totaled 72%.
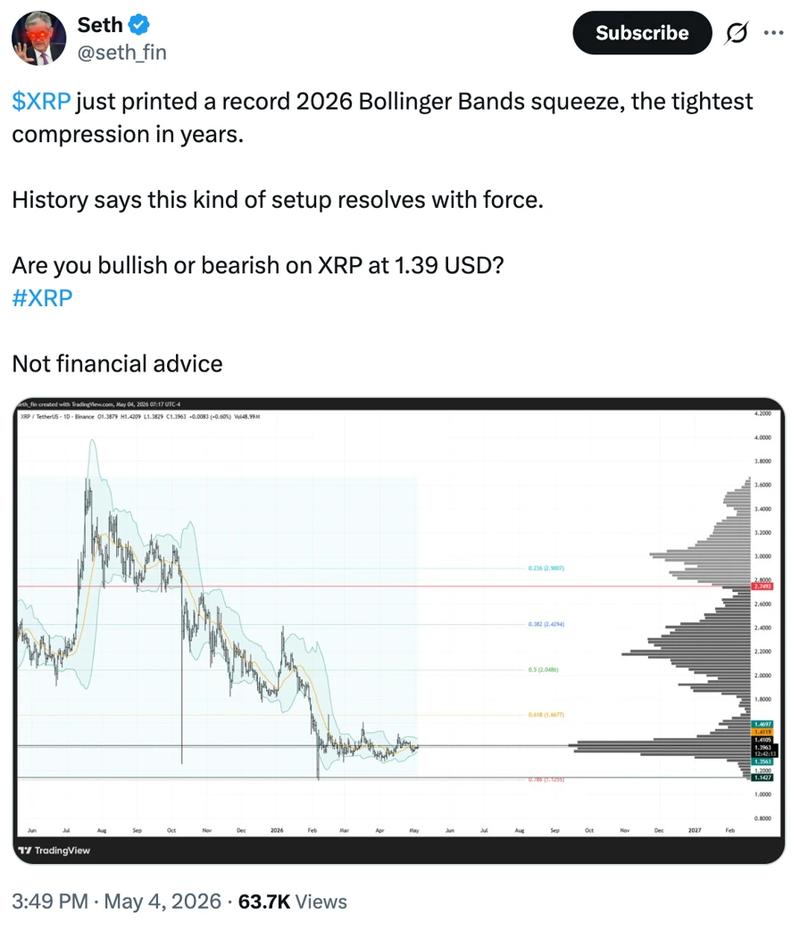
Market analyst Seth observed that XRP has formed the "tightest Bollinger Band squeeze in years" when viewed on the daily timeframe, with the analyst commenting:
"History says this kind of setup resolves with force."
According to previous Cointelegraph reporting, numerous technical indicators have suggested that XRP/USD may be forming a bottom, indicating potential for a rally that could reach as high as $12.
Symmetrical triangle pattern shows breakout in progress for XRP
On the daily chart, the XRP/USD trading pair has successfully broken above a symmetrical triangle formation, a pattern that is typically linked to bullish reversals following extended consolidation phases.
Since February, the price action has been consolidating between two converging trendlines, with the upper boundary now serving as critical support in the vicinity of the $1.40 psychological price level.
Should a daily candlestick achieve a close above this critical level, it could pave the way for upward movement toward the bullish objective of the current chart pattern at $2.05, representing approximately 41% gains from current price levels.
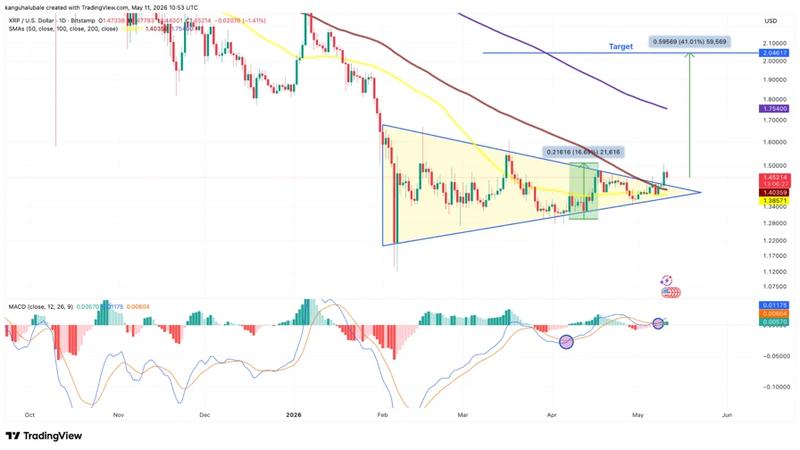
Concurrently, the moving average convergence divergence (MACD) indicator shows trading activity above the zero line and has generated a bullish crossover, signaling increasing buying momentum in the market. Historical analysis reveals that comparable MACD crossover signals have previously preceded significant upward movements in XRP.
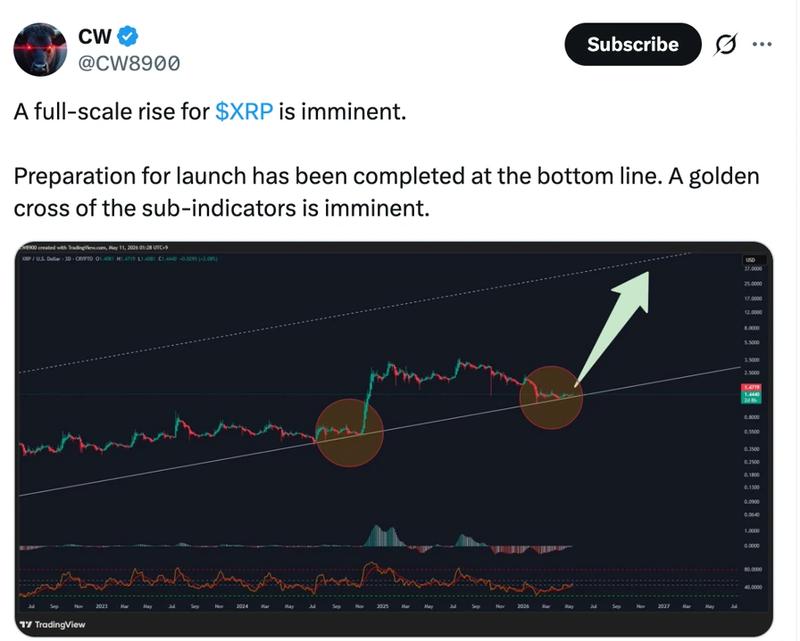
Market analyst CW8900 stated that a "full-scale rise for $XRP is imminent," following the price's bounce from a multi-year support trendline visible on the three-day chart.
According to earlier Cointelegraph coverage, market buyers need to achieve a breakthrough and maintain the XRP price level above the $1.40-$1.61 seller congestion area on the daily chart to confirm a long-term trend reversal.