
Whale Accumulation Signals Potential 20% Rally for Dogecoin After Market Bottom
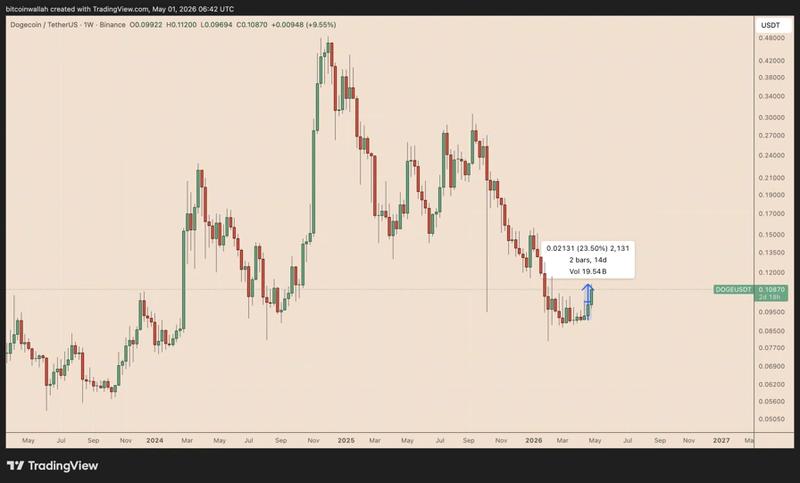
As major DOGE holders reach unprecedented accumulation levels, the memecoin surges 23.5%, building momentum for potential May rally continuation.

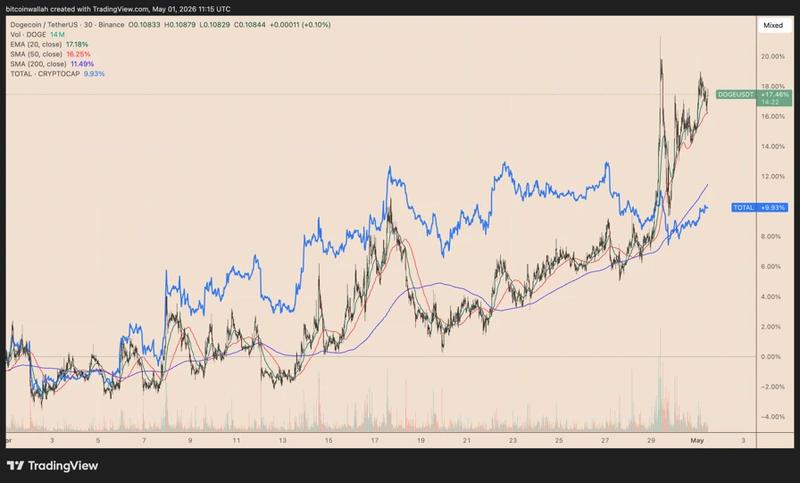
Over the past thirty days, Dogecoin (DOGE) has demonstrated superior performance compared to the wider cryptocurrency market, climbing approximately 18% while the overall market registered just 10% gains, with growing whale accumulation and encouraging technical patterns suggesting a possible market bottom has formed.
Essential highlights:
- Large wallet DOGE holdings reached an all-time high while significant transactions hit a six-month maximum.
- Technical breakout from triangle pattern suggests $0.131 target, while $0.088 represents critical invalidation point.
Record-breaking whale accumulation accompanies April price surge
According to data analytics platform Santiment, wallets containing a minimum of 100 million DOGE reached an unprecedented 108.52 billion DOGE under their control, representing approximately $11.6 billion in value, by the end of April, marking an increase from the mid-April level of under 107.95 billion DOGE.
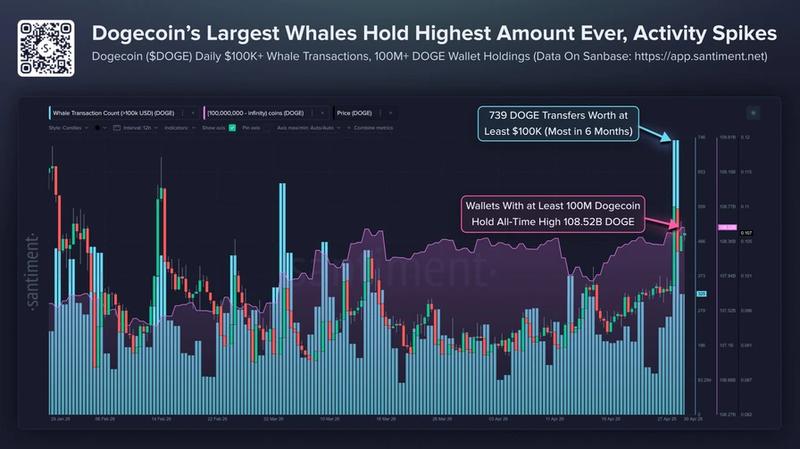
This concentrated accumulation phase aligned perfectly with DOGE's impressive 23.50% price recovery, indicating that these major stakeholders played a significant role in driving the upward price movement.
Large holder transaction activity experienced a notable increase as well. Santiment's data shows that on April 28, the network processed 739 Dogecoin transactions valued above $100,000 within a 24-hour period, representing the highest single-day count observed over the previous six months. This spike in activity occurred in conjunction with 1Shares launching their physically backed Dogecoin ETP on Xetra, which operates as Germany's premier electronic trading venue.
Technical breakout from triangle formation suggests 20% price appreciation
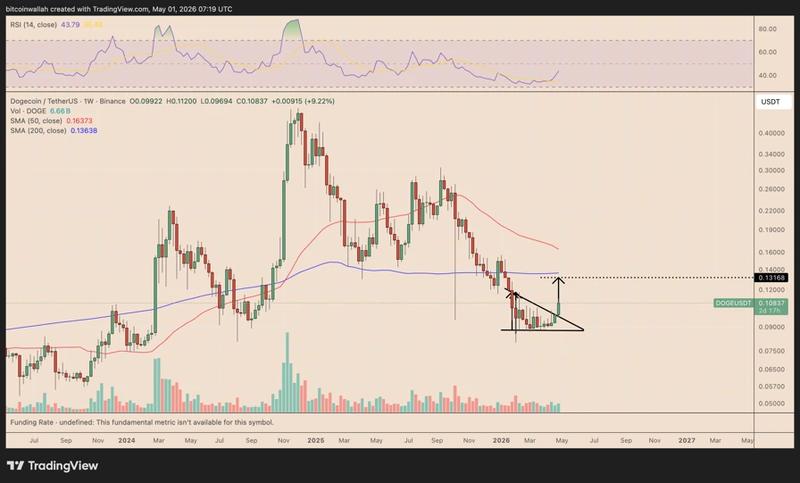
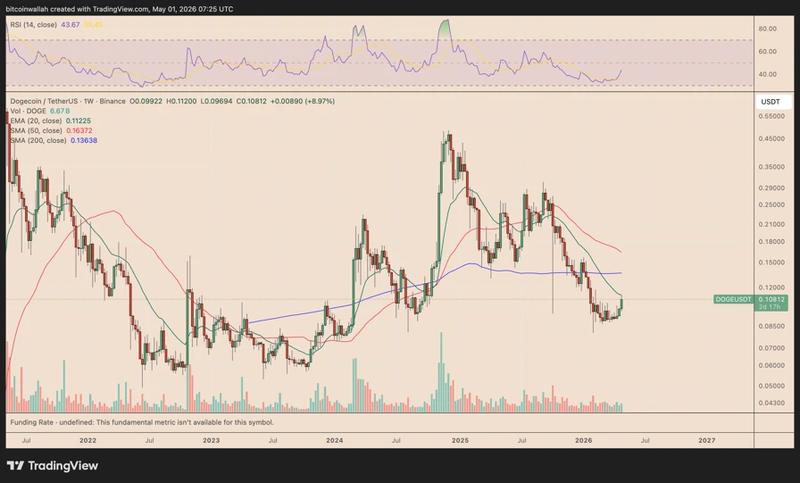
Examining the technical landscape, DOGE's price action has progressed into the breakout phase of what technical analysts identify as a descending triangle configuration.
Within traditional technical analysis frameworks, descending triangle formations typically indicate ongoing selling pressure. These chart patterns conventionally break toward the downside, though upward breakouts can materialize, particularly when occurring within broader accumulation phases.
As an example, BTC developed a multi-month descending triangle formation throughout 2021 following the regulatory mining crackdown initiated by China.
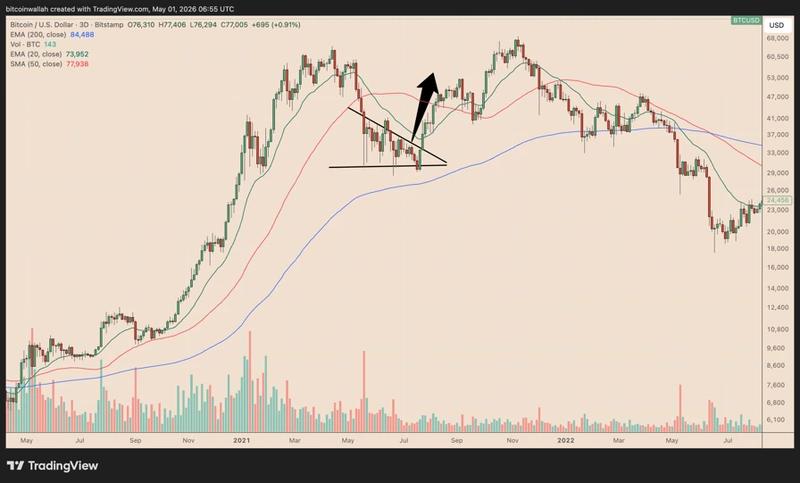
While the pattern exhibited bearish characteristics, Bitcoin's price managed to penetrate above the descending resistance trendline around $35,0000, initiating a short squeeze scenario that propelled prices beyond $52,000 during the subsequent weeks.
When applying identical technical methodology to DOGE's chart structure, the projected upside objective for May centers around $0.131, representing approximately 20% appreciation from present price levels. This target price point corresponds with DOGE's 200-week simple moving average (200-week SMA, represented by the blue line).
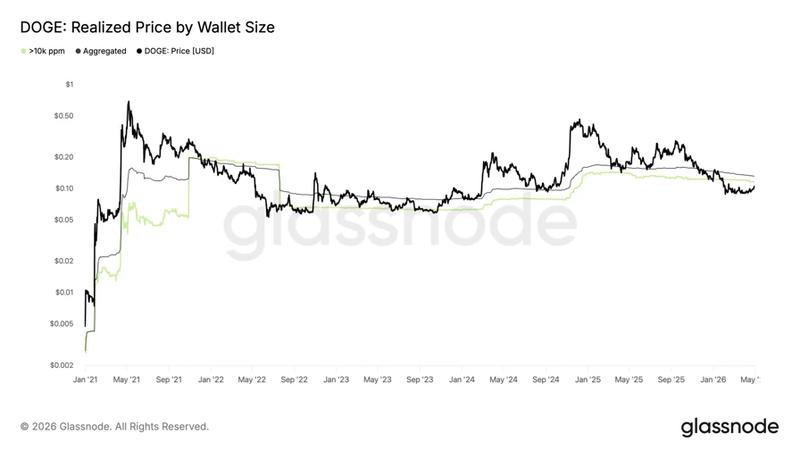
A rally of this magnitude would elevate Dogecoin beyond the mean acquisition price of substantial DOGE wallets containing over 10,000 DOGE (displayed in green), presently positioned near $0.115. Furthermore, it would surpass DOGE's combined cost basis (shown in black) situated around $0.132.
Historical price behavior demonstrates that successfully reclaiming these cost-basis thresholds has typically preceded sustained bullish market phases, as an increasing number of holders transition back into profitable positions and selling pressure diminishes accordingly.
On the other hand, a price rejection occurring near current trading levels, specifically around the 20-week EMA (green) resistance zone, would undermine the bullish breakout scenario. A reversal of this nature could expose DOGE to downside risk, potentially driving price action back toward testing its recent local bottom near $0.088 during May.