
Unique Bitcoin indicator emerges: Could BTC surge 220% from here?
Several long-term valuation frameworks for Bitcoin indicate that the recent decline to $60,000 has created an uncommon discounted entry point. Are institutional players and traders in agreement?

On Tuesday, Bitcoin (BTC) continues to exchange hands beneath the $69,000 threshold, reinforcing expectations that near-term price action will likely remain range-bound. Following the sharp decline to $60,000 and the subsequent rebound toward $72,000, numerous BTC valuation metrics have descended into territory that market observers characterize as significantly undervalued, raising the question of whether market participants will interpret the data similarly.
Key takeaways:
- The realized price band metrics for Bitcoin have converged with a historically significant accumulation territory that has historically preceded fresh all-time highs for BTC.
- According to Power Law quantile modeling, BTC currently resides near the bottom 15% of its historical log-log price channel, a region that has reliably emerged following previous cycle tops.
- Various valuation and momentum indicators are converging around the $40,000–$55,000 range, establishing a structurally important support zone backed by statistical significance.
Long-term DCA zones identified through BTC realized price bands
Since 2015, Bitcoin's realized price metric combined with its shifted realized price counterpart have proven effective at pinpointing extended accumulation phases.
The realized price represents the mean acquisition cost of all BTC based on when it last moved on the blockchain, while the shifted realized price applies a temporal smoothing function to this data, identifying even deeper value opportunities during more severe market corrections.
At present, Bitcoin's realized price is positioned around $55,000, with the shifted realized price hovering near the $42,000 level.
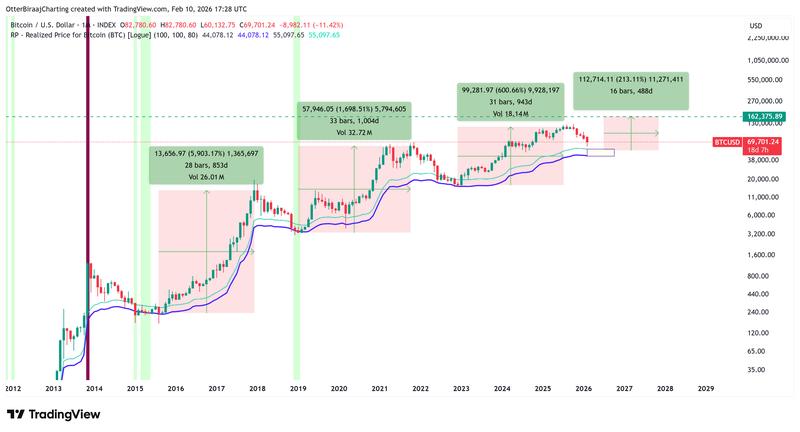
Years of accumulated historical evidence demonstrate that price rallies initiated after revisiting these critical zones have generated substantial returns, as illustrated in the accompanying chart. Although the magnitude of returns has decreased progressively with each cycle, the underlying pattern continues to suggest upside potential ranging from 170% to 220%, which would align with price targets exceeding $150,000 during the subsequent bullish phase.
Historically, Bitcoin has undergone consolidation periods lasting six to eight months following tests of the realized price band territory before transitioning back into an uptrend and establishing fresh price highs.
Bitcoin shows relative undervaluation according to power law model
Made widely known through the work of BTC researcher Giovanni Santostasi, the recently updated power law quantile framework positions BTC around the 14th percentile within its extended log-log price channel, indicating temporary undervaluation in the aftermath of a cycle peak that failed to reach the model's anticipated $210,000 high projected for 2025.
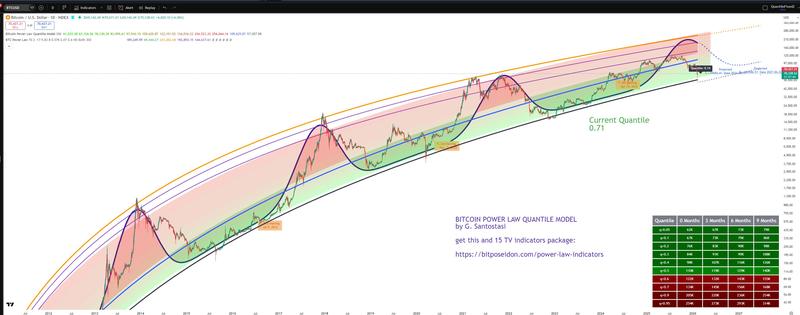
When price action trades near the realized price bands while simultaneously residing in lower power law percentile ranges, this confluence has historically foreshadowed significant market recoveries.
The model's fifth percentile (0.05) has previously identified long-term cyclical bottoms and currently ranges between $50,000 and $62,000, creating an overlap with the accumulation zone established by the realized price band methodology.
Further Bitcoin selloff may precede the next major rally, analysts suggest
According to Bitcoin investor Jelle's analysis, BTC price has experienced approximately a 31% decline from its initial weekly RSI 37 breakdown, a threshold that has historically signaled cycle bottoms dating back to 2014.
Historical drawdowns from this level have spanned between 17% and 55%, with more recent cycles establishing bottoms in the 40–43% range, suggesting possible downside movement toward $52,000 before establishing a sustainable low.
Crypto analyst Sherlock drew attention to a breakdown in the BTC/Gold (XAU) ratio beneath the 15–16 threshold, a technical signal that has historically indicated transitions into bearish market conditions.
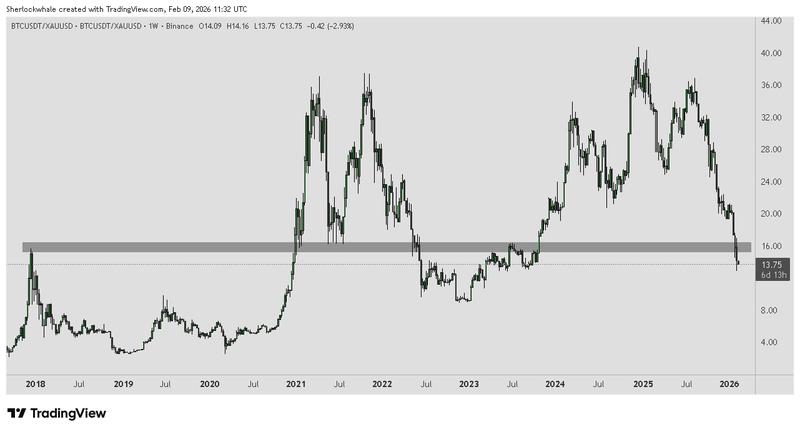
Using this analytical framework, Sherlock cautions that BTC could potentially experience a more substantial retracement into the $38,000 to $40,000 territory should historical patterns repeat themselves.
This article does not contain investment advice or recommendations. Every investment and trading move involves risk, and readers should conduct their own research when making a decision. While we strive to provide accurate and timely information, Cointelegraph does not guarantee the accuracy, completeness, or reliability of any information in this article. This article may contain forward-looking statements that are subject to risks and uncertainties. Cointelegraph will not be liable for any loss or damage arising from your reliance on this information.