
STRC-Funded Bitcoin Acquisitions Back on Agenda for Strategy: Can BTC Reach $80K?
Strategy, led by Michael Saylor, has secured capital to acquire a minimum of 1,111 BTC in the current week, boosting the likelihood of April price increases.

The Bitcoin (BTC) accumulation machine operated by Michael Saylor's Strategy (MSTR) appears poised to restart following a brief hiatus, with the company's STRC preferred stock positioned to finance additional cryptocurrency acquisitions throughout this week.
Key takeaways:
- At least $76.25 million worth of Bitcoin could be purchased by Strategy this week.
- Bitcoin might climb to $80,000 during April when paired with technical chart patterns.
At least 1,111 BTC could be acquired by Strategy this week
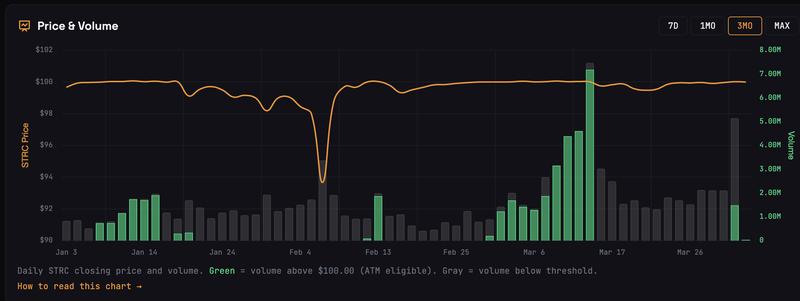
STRC concluded Tuesday's trading session at $100.02, marginally exceeding its $100 par value. When trading meets or surpasses par, Strategy gains the ability to issue additional shares, generate new capital and allocate those funds toward Bitcoin purchases.
Data from STRC.LIVE indicates that by Tuesday's market close, Strategy had accumulated sufficient capital to finance the acquisition of more than 1,085 BTC, with projections showing the weekly aggregate climbing above 1,111 BTC. This translates to approximately $76.25 million.
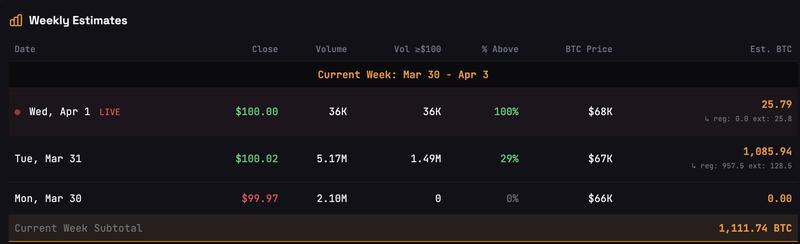
This represents a departure from the preceding week's performance, during which STRC spent most of its time trading beneath par and produced zero estimated BTC acquisitions.
According to the company's most recent filings, Strategy owned 762,099 BTC as of late March, with an average purchase price of approximately $75,694.
Bitcoin price recovers as Strategy's purchasing window becomes active again
The reopening of the buying window has aligned with an upward movement in Bitcoin valuations.
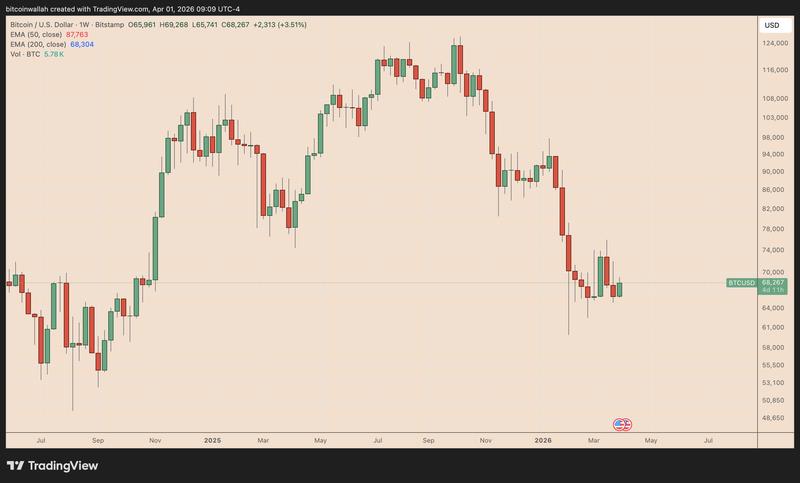
From Tuesday onward, BTC/USD has surged more than 5%, momentarily touching nearly $69,300. This upward trajectory echoes previous increases observed during timeframes when Strategy was aggressively raising funds through STRC for Bitcoin acquisitions.
A notable instance occurred during the week concluding March 15, when Bitcoin appreciated more than 10% notwithstanding weak overall risk appetite. During that identical timeframe, Strategy acquired 22,337 BTC valued at roughly $1.57 billion.
The reverse pattern materialized subsequently. Bitcoin experienced a 14.55% decline throughout the following two weeks, roughly corresponding with Strategy's purchasing hiatus as STRC dropped below its $100 par value.
On March 23, Strategy announced a $44.1 billion capital-raising capability to acquire additional Bitcoin through the sale of STRC and other preferred stocks, signaling that it would continue as a substantial source of Bitcoin demand throughout upcoming months.
Stretch Dividend Rate maintained at 11.50% for April 2026. $STRC
— Michael Saylor (@saylor) April 1, 2026
$80K target for Bitcoin after bouncing from flag support level
From a technical analysis perspective, Bitcoin's recovery commenced following a successful retest of the lower boundary of its current bear flag pattern serving as support.
Should the recovery build additional momentum, BTC could progress toward the flag's upper trendline positioned near $80,000 during April, especially if supported by resumed Strategy purchasing activity and indications of diminishing Iran war tensions.
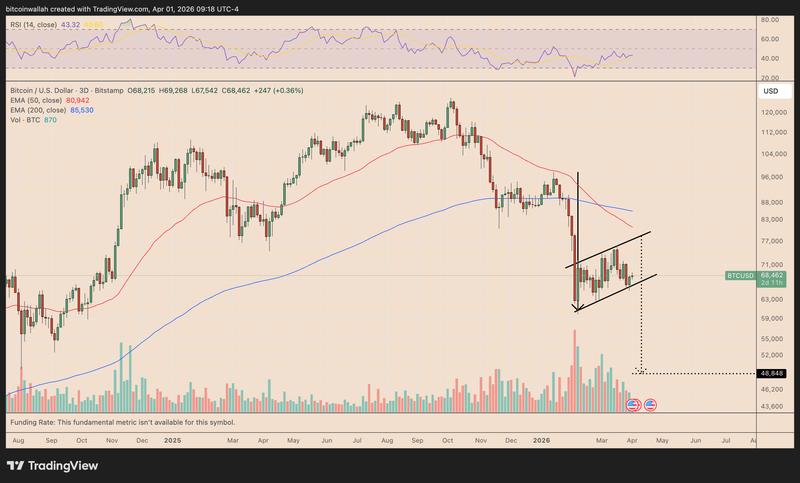
The $80,000 upward projection also corresponds with the 50-period exponential moving average displayed on the three-day chart, establishing this region as a critical near-term resistance level.
On the other hand, Bitcoin faces the risk of breaching the flag's lower trendline support and validating the pattern's characteristic bearish breakdown should those favorable catalysts dissipate.
Under that scenario, the calculated downside objective would materialize near the $49,000–$50,000 range. This corresponds with the bearish projections articulated by numerous analysts previously.