
ETH Faces Deeper Losses as Price Breaks Through $2,000 Mark, Traders Warn
Market analysts warn that Ethereum could experience additional downward pressure following the breakdown of the crucial $2,000 level, with bulls unable to maintain support amid weakening demand indicators.

The decline of Ether (ETH) beneath the $2,000 threshold on Friday has positioned the cryptocurrency for a potentially more significant pullback in the weeks and months ahead.
Key takeaways:
- Ethereum's price action demonstrates structural fragility as it loses the psychological $2,000 support level.
- Market observers indicate ETH could decline further into the $1,750-$1,850 support area.
- Demand for Ether remains in negative territory, amplifying the potential for continued downward movement.
Market analysts expect additional downside for Ether
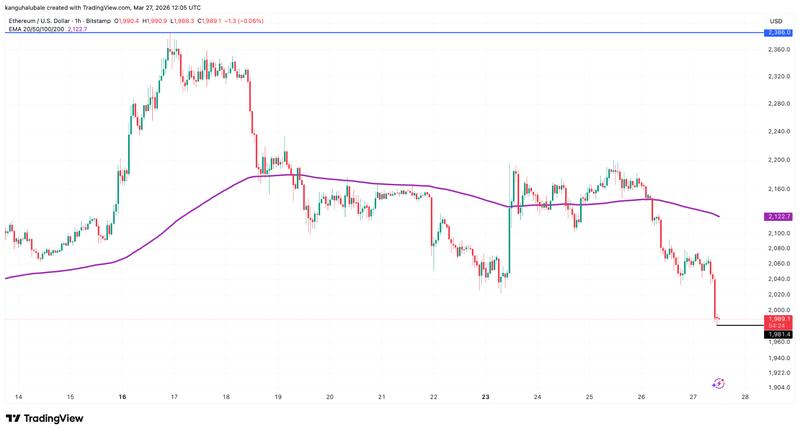
According to information from TradingView, the ETH/USD pair was changing hands at $1,975, representing a 5% decline across the previous 24-hour period. The price movement coincided with liquidations of long ETH positions exceeding $111 million.
The trading pair was unable to push through the resistance level positioned at $2,200 earlier during the week, as outflows from spot Ether exchange-traded fund (ETF) products, diminishing decentralized exchange (DEX) trading volumes, and a decreasing ETH futures premium undermined the cryptocurrency's attempted recovery.
"$ETH keeps pressing into the same resistance, but the story sits beneath price action," trader Onur said in an X post on Friday, adding:
"Even with strong long-term narratives, short-term demand still looks thin."
Another market analyst, CryptoWZRD, projected that ETH might experience a "further decline" in the direction of the $1,800 support area following the altcoin's close beneath $2,200 on Thursday.
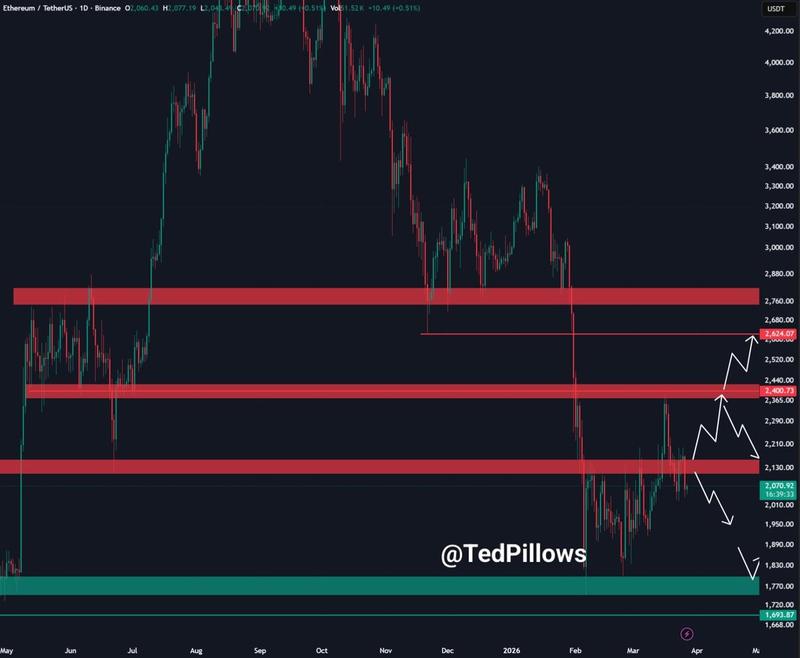
"$ETH has dropped below the $2,100 level," analyst and trader Ted Pillows said in a Friday X post, adding:
"This is a sign of weakness and shows what's coming next for ETH."
A chart included with the analysis indicated that the cryptocurrency's price might initially decline toward the $1,800 support threshold before experiencing a potential rebound.
As previously reported by Cointelegraph, a closing price beneath the 50-day simple moving average positioned at $2,000 could drag the ETH/USD trading pair down to $1,900, and then potentially to the $1,850-$1,750 range.
Ethereum's apparent demand reaches 16-month low point
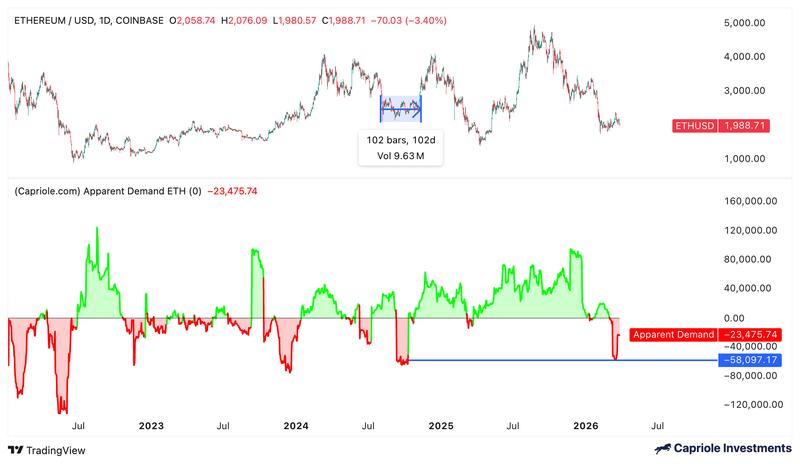
The Apparent Demand metric for Ether has turned negative following a decline to its weakest point since October 2024, as market participants embraced a risk-averse approach amid geopolitical uncertainties and unfavorable macroeconomic conditions.
The Ethereum Apparent Demand indicator from Capriole Investment demonstrates that ETH demand has remained in negative territory since March 3, reaching a bottom near -58,000 ETH on March 16, representing 16-month lows. Since then, the metric has recovered to -23,475 ETH at the time of writing.
At the same time, spot ETH ETF products have witnessed net outflows spanning seven consecutive trading days, accumulating a total of $391.8 million in withdrawals.
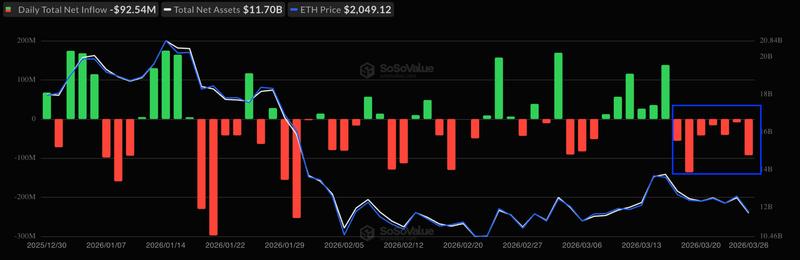
International Ether exchange-traded products (ETPs) similarly experienced outflows totaling $27.2 million throughout the previous week, further confirming diminished institutional investor appetite for ETH.