BTC's climb toward $77K squeezes short positions, yet limited spot and leverage activity restricts upward momentum
Bullish traders attempted another push past Bitcoin's $77,000 resistance level, yet reluctance to expand margin positions and spot holdings, combined with profit-taking behavior, constrains the power of successive rally attempts.

Market participants driving Bitcoin (BTC) managed to elevate the asset's price to the $77,400 level, though available data indicates that profit-taking activities might prevent bulls from successfully establishing the $77,000 to $80,000 range as a stable support zone.
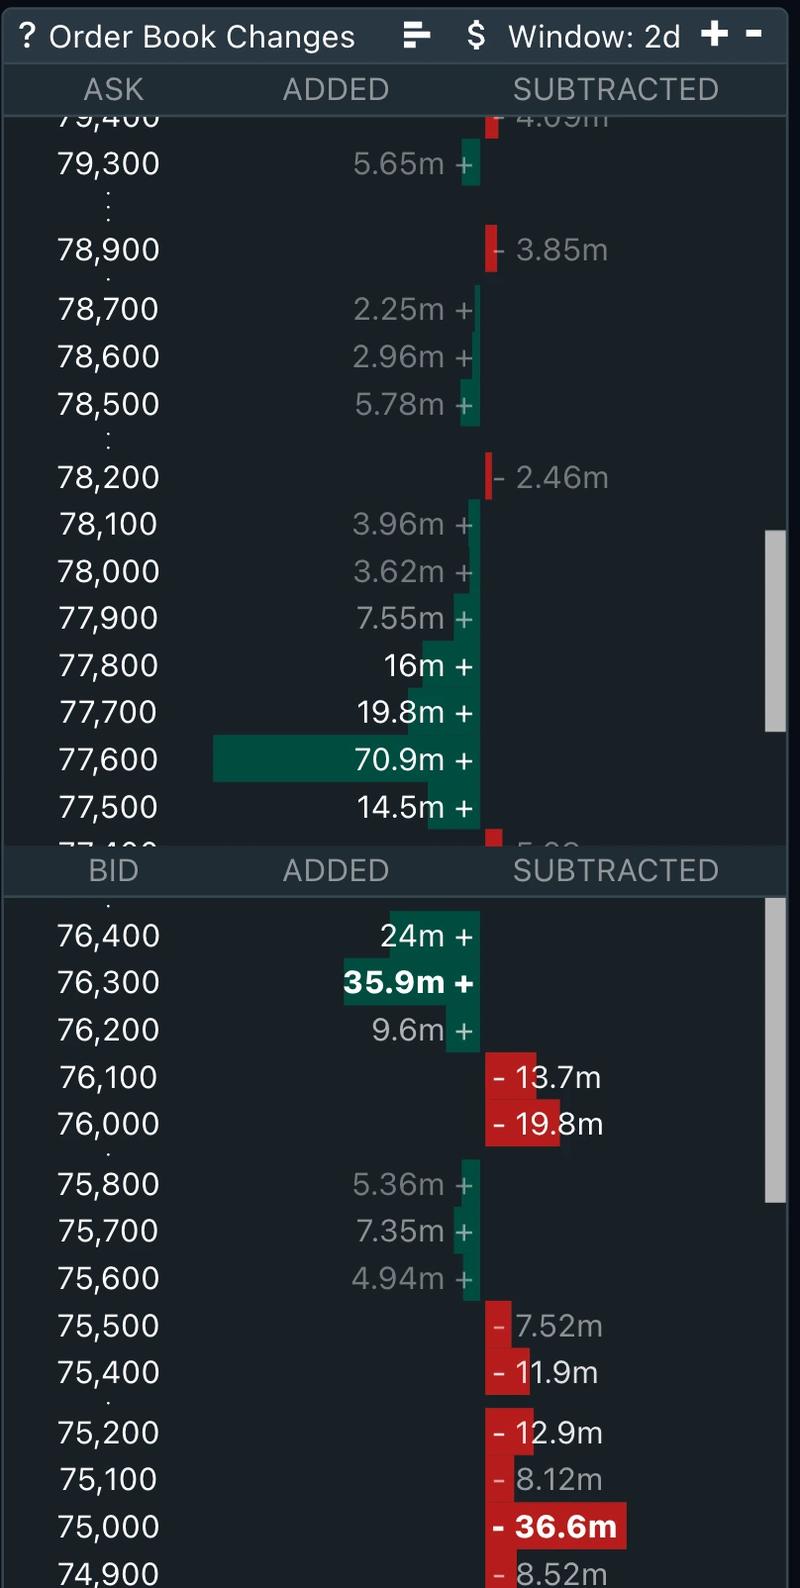
Analysis of orderbook information provided by TRDR reveals more than $130 million worth of ask orders spanning from the $76,700 level up to $79,300.
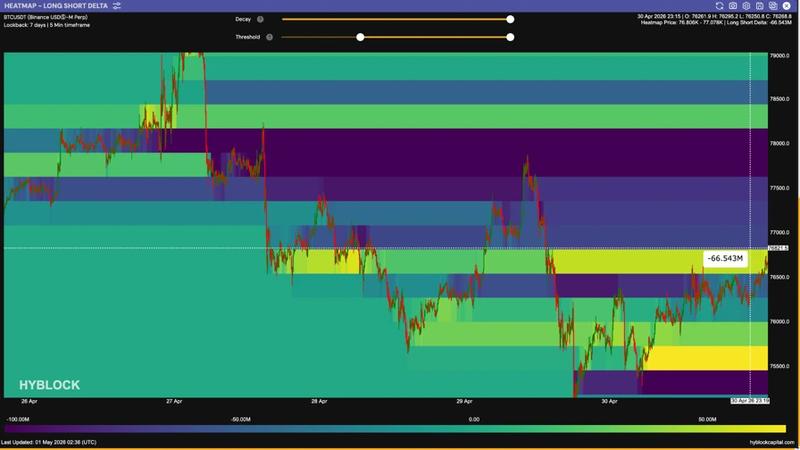
Considering the negative funding rate present in Bitcoin futures markets alongside the modest negative reading in the long-short delta (standing at -$1.47 million as of this writing), bullish market participants maintain a marginal advantage for the near term.
This dynamic has the potential to tilt even more favorably toward bulls should BTC's valuation advance into the short liquidity zone beginning at $76,800, a region characterized by a -$66.5 million to -$189 million negative delta, indicating that short position holders face substantially elevated exposure to forced liquidations.
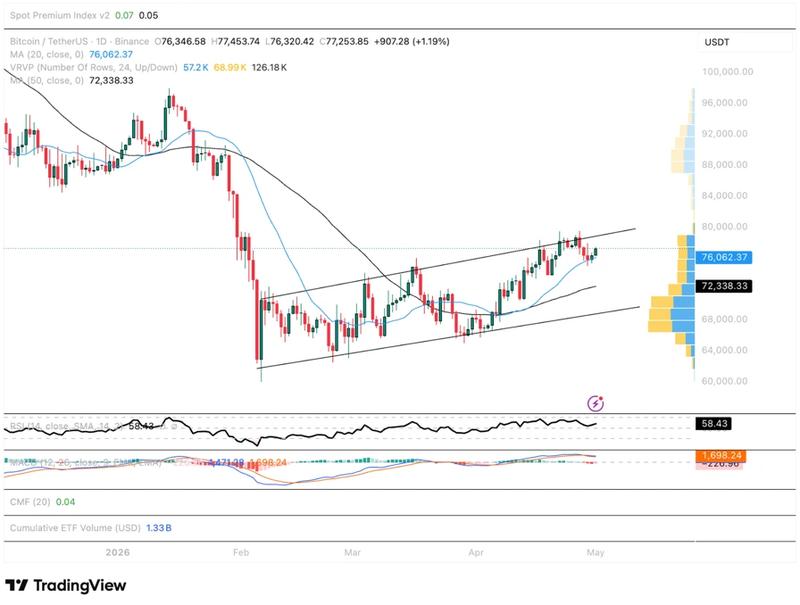
When examining the situation through a technical analysis lens, recent price movements enabled Bitcoin to establish $75,000 as a dependable support level via a validated support-resistance flip, while also returning to trade above the 20-day moving average (positioned at $76,067) following a decline beneath this threshold on Wednesday and Thursday.
Looking at the near-term outlook, the optimal scenario for bullish traders would involve a replication of the price behavior witnessed earlier this week, wherein BTC would advance through the channel trendline resistance situated at $79,000, subsequently followed by an additional SR-flip that would validate $80,000 as a solid support foundation.
In addition to the anticipated profit-taking pressure emerging at the $77,000 threshold, a notable surge in trading volume across either spot markets or perpetual futures platforms represents the absent catalyst needed to counterbalance the selling pressure and prolong BTC's breakout movements.
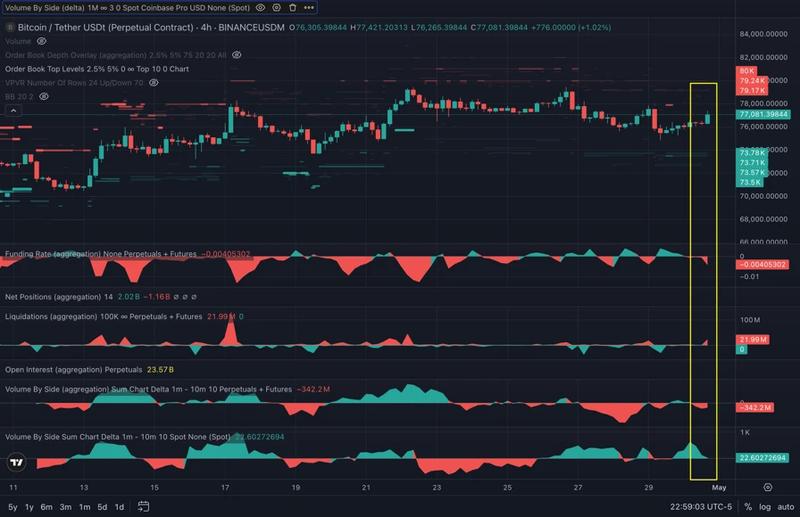
The TRDR chart presented below demonstrates that the majority of Bitcoin's price fluctuations throughout the trading day originate from liquidation events, with the lack of persistent spot market volume and long-leverage commitment leading to rally attempts that prove short-lived.