
BTC Tumbles to $82.7K Monthly Bottom as Treasury Yields Surge Amid Iranian Tensions
The flagship cryptocurrency dropped beneath the $83,000 threshold to hit its lowest point this month while equities pulled back from record peaks and Treasury yields climbed sharply.

The world's leading cryptocurrency Bitcoin (BTC) experienced additional downward pressure during Wednesday's opening of Wall Street trading as petroleum prices climbed on headlines surrounding US-Iran military tensions and equity markets retreated from historic peaks.
Key points:
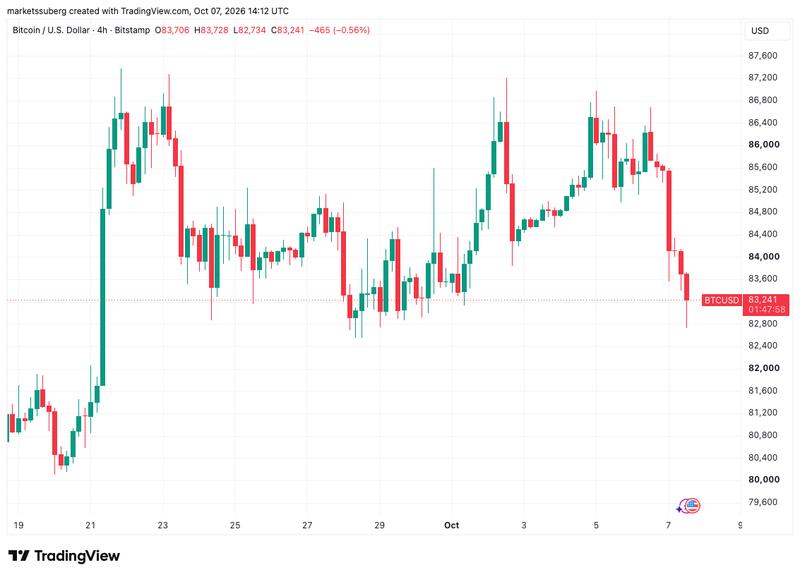
- The digital asset touched $82,734 on the Bitstamp exchange, representing the month of October's lowest trading levels thus far.
- Treasury bond yields jumped to fresh 24-year peaks while Brent crude petroleum prices climbed to $102 per barrel following Iranian statements regarding transit through the Strait of Hormuz.
- Technical analysis of BTC price action indicates weakening demand across both spot exchanges and futures markets.
Treasury yields reach 24-year peak amid Iran petroleum restrictions
Market information from TradingView demonstrated BTC/USD sliding beneath the $83,000 level, establishing fresh month-to-date minimums.
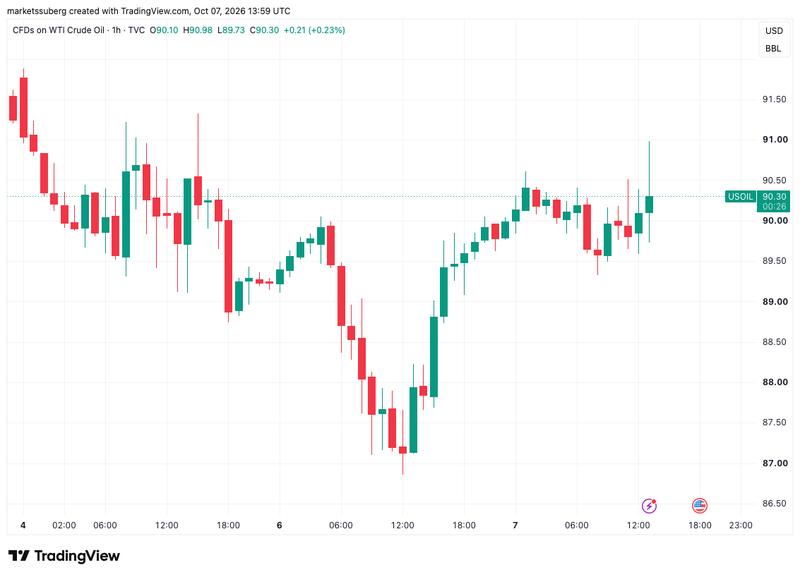
Conflicting messages concerning petroleum tanker movement through the Strait of Hormuz drove Brent crude petroleum prices to $102 per barrel during the trading session, with WTI crude climbing to $91.
A consultant to the Commander of Iran's Revolutionary Guards cited by Reuters during the day issued a warning about restrictions on maritime traffic that authorities had "deemed illegal."
The Strait of Hormuz is closed, and the armed forces of the Islamic Republic of Iran have full control over it. This situation will continue until Iran's legitimate demands are met.
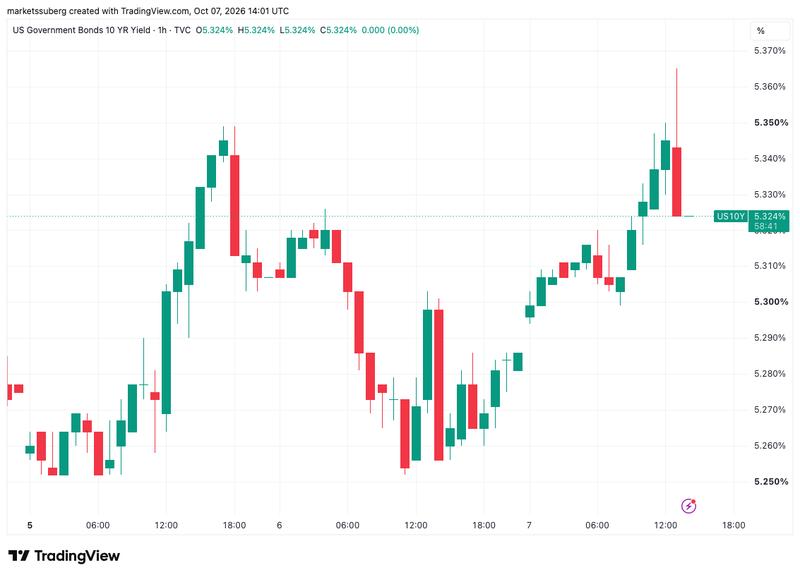
Treasury bond yields in the United States, which demonstrate high sensitivity to inflation worries and sovereign debt burdens across global markets, responded by touching fresh 24-year peaks. The 10-year and 30-year Treasury yields climbed to 5.36% and 5.73%, respectively.
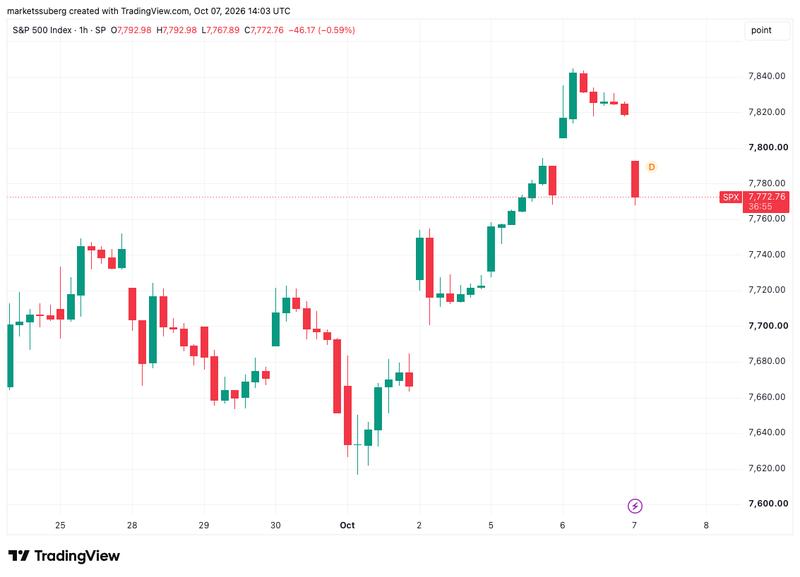
Simultaneously, equity markets in the United States moved into negative territory following their achievement of new record highs during Tuesday's session. The S&P 500 index declined 0.6% during the day to settle at 7,773 points.
Muhammad Qubbaj, who serves as co-head of North America interest rate product sales and trading at Goldman Sachs FICC and Equities, issued a forecast that yields would "likely be under ongoing pressure amid elevated energy prices and subdued demand from institutional investors," according to reporting on Tuesday.
During a webinar presentation, he projected that increasing petroleum prices would "likely be the key factor in longer-term interest rates."
Cryptocurrency demand weakens as bullish momentum dissipates
As Bitcoin continues to struggle with breaking through resistance represented by ask liquidity positioned around $87,000, market analysis indicated deteriorating demand across both spot exchanges and derivatives trading platforms.
Since September 22, Bitcoin has remained at a similar price level, while Bitcoin Open Interest has declined by nearly 10%, from approximately $28.8B to $26.0B. This suggests that, amid subdued spot demand, futures traders have also shown limited willingness to take on additional risk.
CryptoQuant
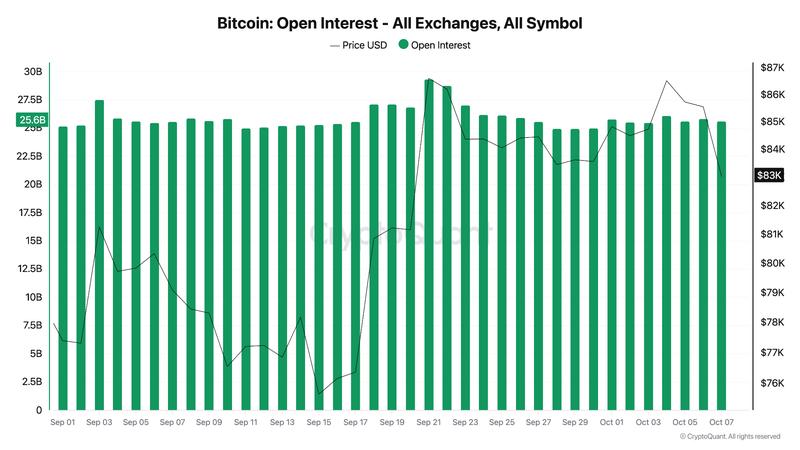
The decline to $83,000 negated the support level that had previously been established by Bitcoin's 21-day simple moving average (SMA) positioned at $83,850. CryptoQuant further noted that when examining higher time frames, the $69,500 level merits attention as it represents the average acquisition price for Bitcoin short-term holders — market participants who maintain their positions without liquidating for periods up to six months.