
BTC Surges Past $76K Following Softer-Than-Expected US PPI Data: Can Bitcoin Maintain Momentum?
The world's leading cryptocurrency climbed to heights last witnessed in early February following a US Producer Price Index reading that came in significantly lower than anticipated.
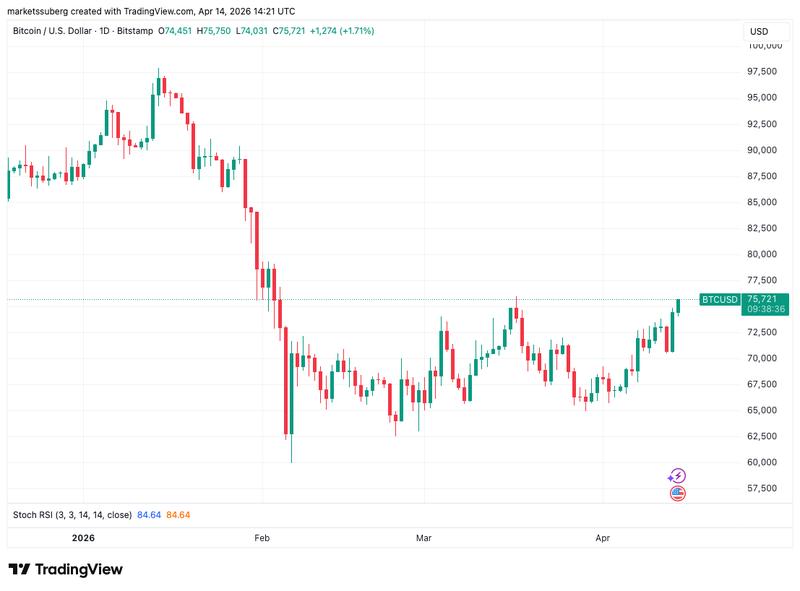
On Tuesday, Bitcoin (BTC) climbed to monthly peak levels exceeding $76,000 following the release of US inflation figures that continued to provide support for risk-oriented assets.
Key points:
- The cryptocurrency's upward movement persists with bullish traders eyeing $76,000 — a price level not witnessed since the beginning of February.
- Producer Price Index inflation in the United States continues to fall short of market forecasts even as the Iranian conflict shows no signs of resolution.
- Cryptocurrency traders maintain a risk-off stance despite broader market resilience.
BTC climbs above $76,000 as concerns mount that "inflation has returned"
According to information from TradingView, fresh local peaks reached $76,038 on the Bitstamp exchange — representing Bitcoin's strongest showing since the middle of March and positioned to achieve a two-month high.
The Producer Price Index (PPI) reading for March registered below anticipated levels in spite of the ongoing US-Iran military conflict.
"On an unadjusted basis, the index for final demand rose 4.0 percent for the 12 months ended in March, the largest 12-month advance since increasing 4.7 percent in February 2023," according to an official release from the US Bureau of Labor Statistics (BLS).
"The March rise in final demand prices can be attributed to a 1.6-percent advance in the index for final demand goods. Prices for final demand services were unchanged."
Market participants had anticipated a year-over-year rise of 4.7%, along with a month-over-month increase of 1.1% — however, the actual figure registered at 0.5%.
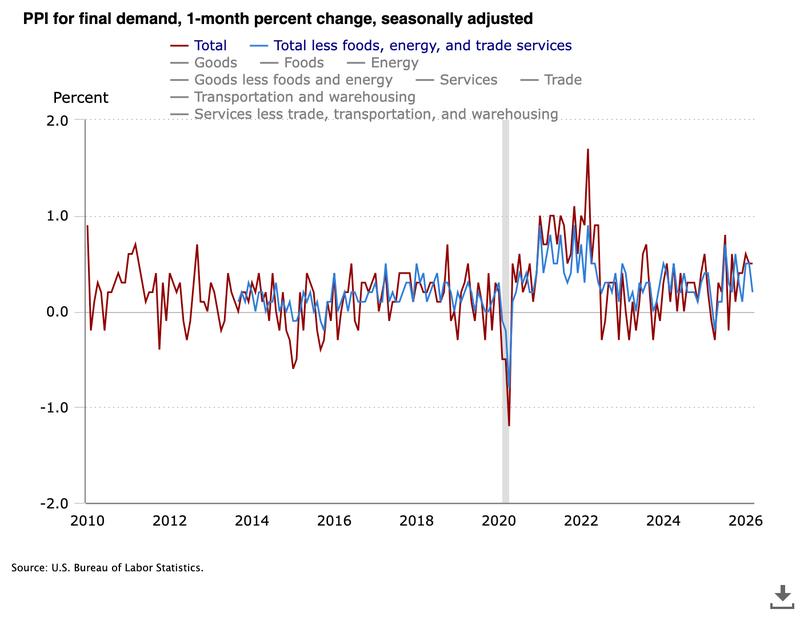
Nonetheless, market responses took a hawkish tone, highlighting that inflation was demonstrating an unmistakable upward trajectory when viewed holistically.
"We are now officially seeing inflation metrics in the US that are at 4% or higher," stated trading resource The Kobeissi Letter in a post on X.
"Inflation is back."
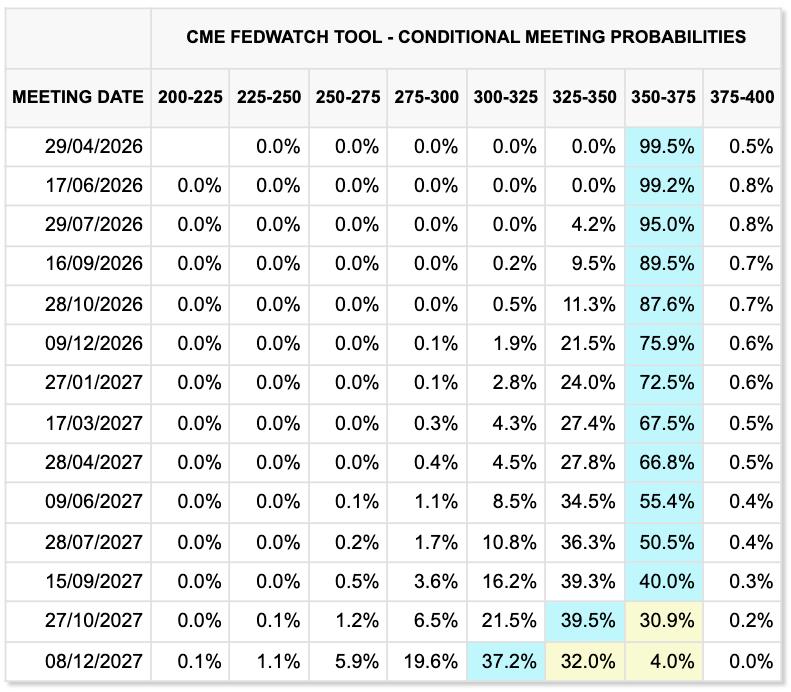
In response, financial markets maintained expectations for Federal Reserve interest-rate reductions squarely at the conclusion of the following year, according to information from CME Group's FedWatch Tool.
The 21-week trend line for Bitcoin represents a critical threshold
Within trading circles, the price movement of BTC continued to generate skepticism and caution.
The pseudonymous cofounder of trading community Wealth Capital, CryptoReviewing, observed that the push toward $75,000 had set off a cascade of short position liquidations.
As previously covered by Cointelegraph, market players had already been positioning themselves for a potential short squeeze, given that price remained confined within its established local trading range.
"Bitcoin's recent PA hasn't deviated much from what we saw in 2022," stated Keith Alan, cofounder of trading resource Material Indicators, in commentary provided on the same day.
"Nothing says that $BTC has to continue to mimic history, but if it does we should see price flirt with the 21-Week Moving Average ~$78.3k."
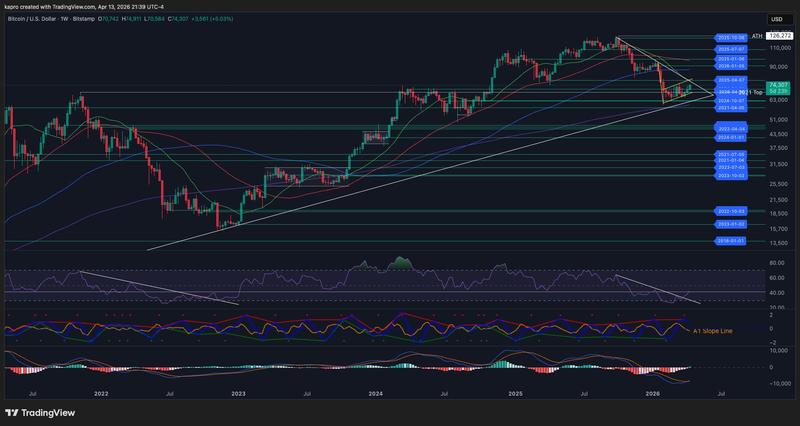
According to Alan, the trend line would represent a formidable resistance level that would "not be an easy level to break."
"A rejection from that level would send the Weekly RSI back below the R/S flip line at 41, and send BTC to the next leg down," he cautioned, making reference to the relative strength index (RSI) technical indicator.
Previously, Cointelegraph had provided coverage on preliminary RSI signals pointing to a potential bear-market trend reversal.
Conversely, the US passage of the CLARITY Act combined with a conclusion to the Iranian war could potentially drive Bitcoin back in the direction of its yearly opening price level of $87,500.