
BTC Drops Under $65K Amid Rising Iran Tensions, Oil Nears $100, Bond Yields Climb
Cryptocurrency analysts split on Bitcoin's trajectory as escalating US-Iran hostilities drive oil markets toward triple digits and bond yields higher, with Federal Reserve rate increase probability climbing to 40% for July.

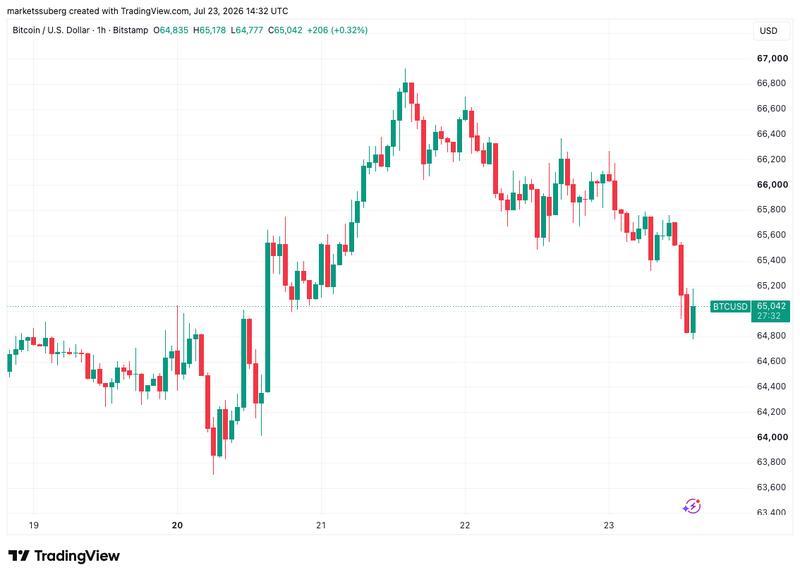
The price of Bitcoin (BTC) dropped beneath the $65,000 threshold on Thursday following a decline in United States equities markets triggered by fresh escalation involving Iran.
Key points:
- Multiple days of mounting US-Iran tensions are starting to negatively impact both cryptocurrency and equity market valuations.
- Bitcoin experiences its lowest point in three days, falling below $65,000 while market participants remain divided on short-term price direction.
- The 21-day moving average trendline emerges as a critical support level in close proximity.
Bitcoin wavers as Iranian conflict disrupts equities, crude oil and Treasury yields
According to information from TradingView, the BTC/USD trading pair reached a three-day low point of $64,799 on the Bitstamp exchange.
Markets considered risky experienced pressure throughout the trading session after United States President Donald Trump issued a warning stating he would hold Iran responsible for recent attacks by Houthi forces targeting Saudi Arabian merchant ships.
Through a message published on Truth Social, Trump expressed being "very disappointed" regarding the Houthis' actions, making reference to assaults on American vessels dating back to 2025.

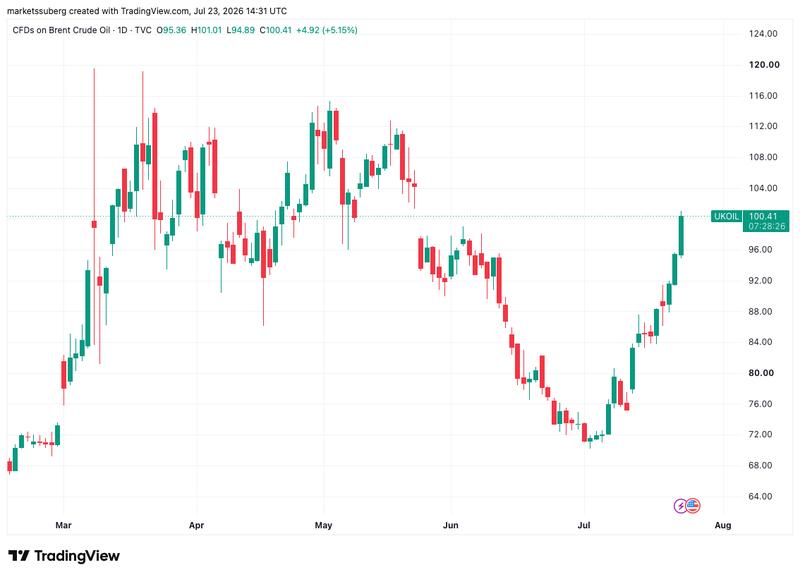
When New York trading concluded for the day, the S&P 500 index had experienced a 1.2% decline while the Nasdaq composite dropped 2.2%, and simultaneously, petroleum prices surged to levels not witnessed since the beginning of June, with Brent crude oil exceeding the $100 per barrel milestone.
"Inflation expectations and interest rates are rising sharply again," market analysis resource The Kobeissi Letter commented in a post on X.
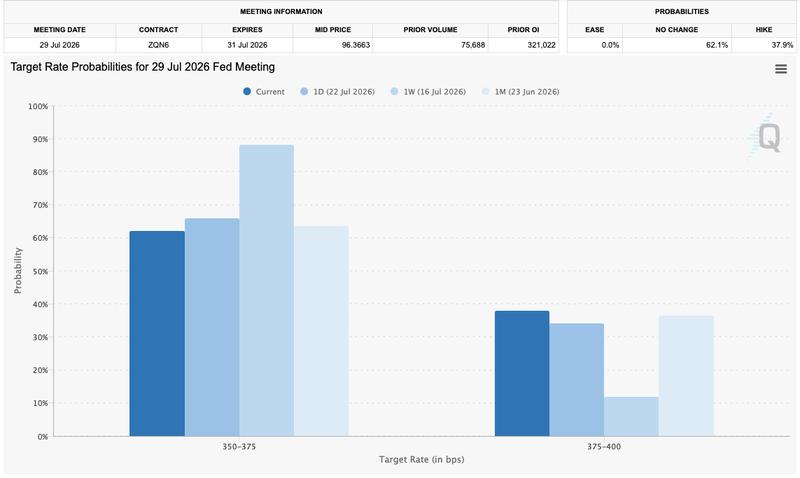
In advance of the Federal Reserve's upcoming interest-rate policy determination, information from CME Group's FedWatch Tool indicated a growing probability of policymakers implementing a 0.25% increase — conventionally viewed as unfavorable conditions for cryptocurrency markets. The likelihood approached 40% on Thursday, representing a significant jump from the previous week's figure closer to 12%.
Kobeissi separately highlighted that US 10-year bond yields had climbed to 18-month peak levels, signaling renewed pressure on the economy.
BTC price analysis offers hope of $73,000
Market participants trading Bitcoin demonstrated growing disagreement regarding the direction of near-term BTC price movement.
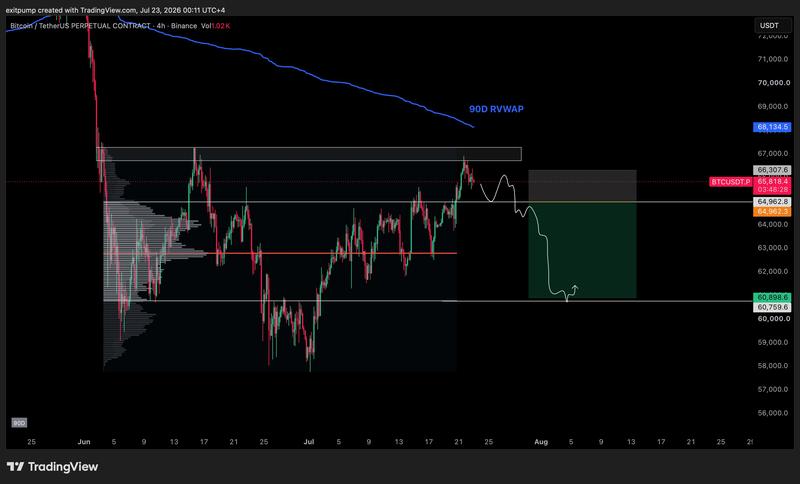
Market analyst Exitpump suggested that the Bitcoin recovery rally is approaching its conclusion by the end of July, bolstering an existing hypothesis that has already received widespread attention.
"July rally is coming to end, price is at resistance, close your longs, go short once price breaks below 65K," they communicated to X followers during the late hours on Wednesday.
Alternative perspectives emerged as more optimistic, with market trader Jelle maintaining that price action was "still making progress."
"Clear this local area and that void towards $70k opens up - could be a quick move to form the new range. Patience remains my game," he shared.
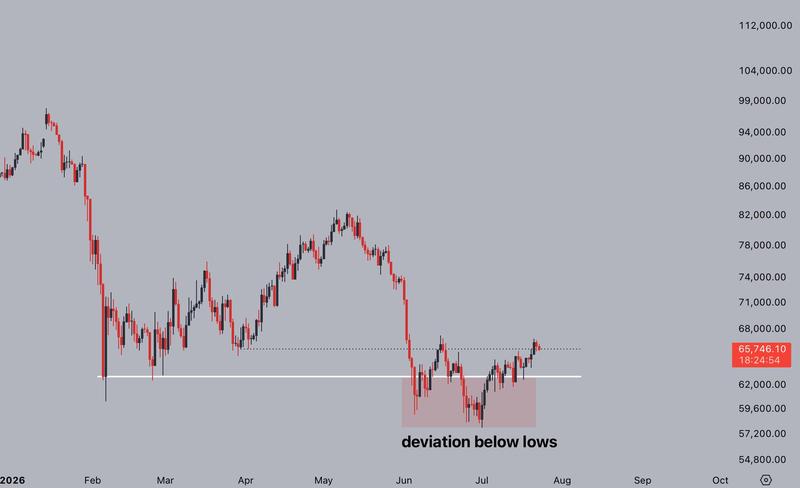
In the view of cryptocurrency trader and market analyst Michaël van de Poppe, the 21-week simple moving average (SMA) positioned at $64,073 represented a critical level.
"Theoretically, the target area for Bitcoin is reached. However, as long as this stays above the 21-Day MA, I'm sure there will be a higher valuation for Bitcoin in the near-term," stated an X post published on the day, continuing:
"It's facing the final hurdle for a big breakout, which is the $68,000 resistance zone. It's been tested once, and this is the second test that we'll be facing."
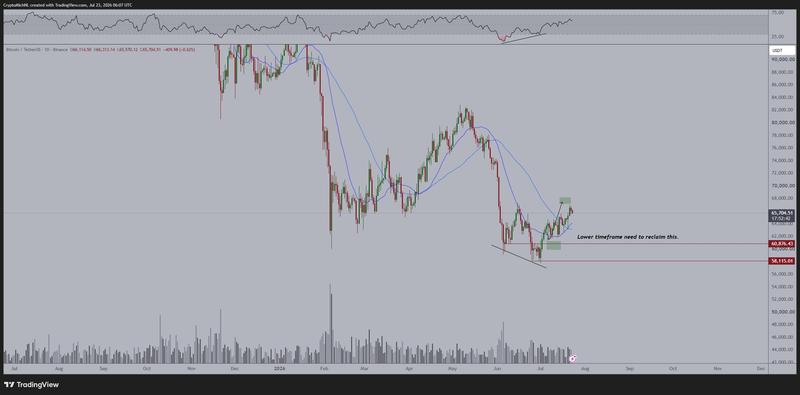
Van de Poppe projected a price objective of $73,000 in the event that bullish forces manage to penetrate through the resistance barrier.