
BTC Could Surge Back to $85K Following CME Institutional Traders' Short Position Reduction
Institutional futures traders dramatically reduced their bearish positions on Bitcoin last month, mirroring patterns that led to a 70% surge in 2025 and a 190% price jump in 2023.

The Bitcoin (BTC) market found its floor following a shift to net bullish sentiment among CME futures speculators during April 2025. An analogous repositioning pattern is emerging once again in 2026, suggesting increased probability for a BTC price rebound over the next several weeks.
Main highlights:
- Institutional investors decreased their short positions on Bitcoin throughout the previous month.
- This type of sentiment reversal came before a 70% BTC price surge in 2025 and a 190% appreciation in 2023.
CME BTC futures and technical indicators point to $85,000 price level
According to the CFTC Commitment of Traders (COT) report released last week, non-commercial Bitcoin futures traders reduced their net position to approximately -1,600 contracts from around +1,000 contracts one month prior.
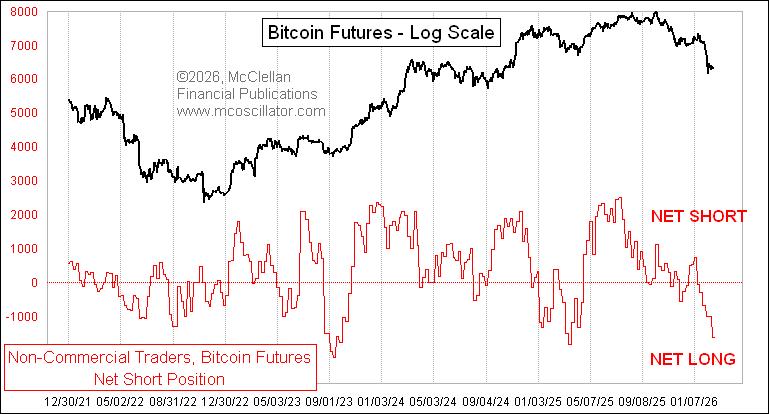
What this indicates in practical terms is that major speculators, which include hedge funds and comparable financial entities, have transitioned from net short positioning to long, resulting in bullish traders now exceeding bearish ones on the CME exchange.
The swift unwinding of net-short positions suggests that "smart money" accumulated long positions "with some urgency," according to analyst Tom McClellan, who highlighted two comparable historical shifts that came before Bitcoin price bottoms.
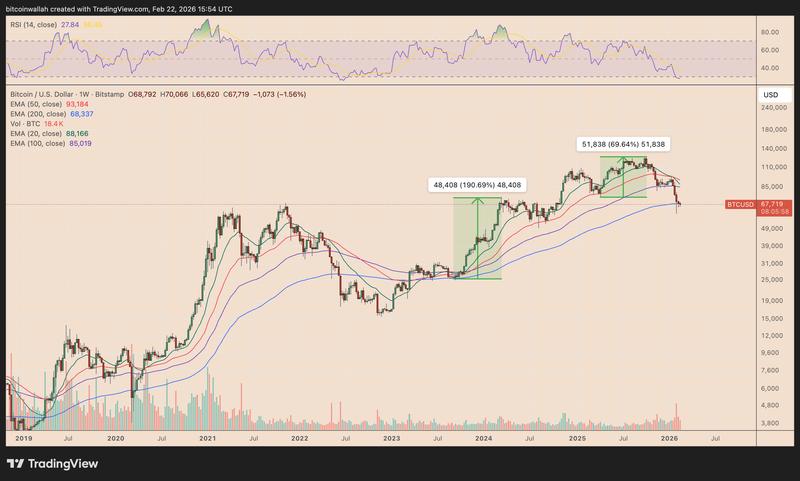
As an example, BTC's price increased approximately 70% following a significant decline in CME Bitcoin futures net shorts during April 2025. During 2023, BTC price climbed by more than 190% amid similar futures market dynamics.
As of February, the institutional money shift is appearing yet again, precisely as Bitcoin maintains support at its 200-week exponential moving average (200-week EMA, the blue line), which has served as a bear-market support level during most significant pullbacks over the past ten years.
By Sunday, BTC's 200-week EMA was positioned close to $68,350.
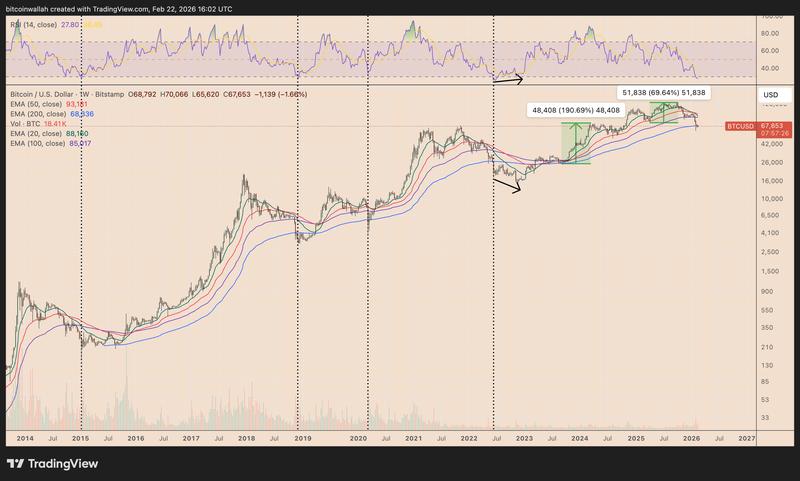
During previous occasions when Bitcoin traded near this moving average throughout severe corrections (in 2015, 2018 and 2020), it ultimately signaled the conclusion of the downward trend and the beginning of a fresh recovery period.
Bitcoin's weekly relative strength index (RSI) continues to reside in oversold conditions, indicating that downward pressure is approaching depletion.
This further increases Bitcoin's probability of rebounding during the upcoming weeks. A conclusive bounce from the 200-week EMA might initiate a climb toward the 100-week EMA (the purple wave) at approximately $85,000 by April.
Bitcoin bulls face continued uncertainty
McClellan warned that the institutional money shift represents "a condition, not a signal," which means Bitcoin may still decline from its present price range before establishing a lasting bottom.
This could replicate the 2022 situation, during which BTC dropped by more than 40% following a break beneath its 200-week EMA despite comparable oversold readings.
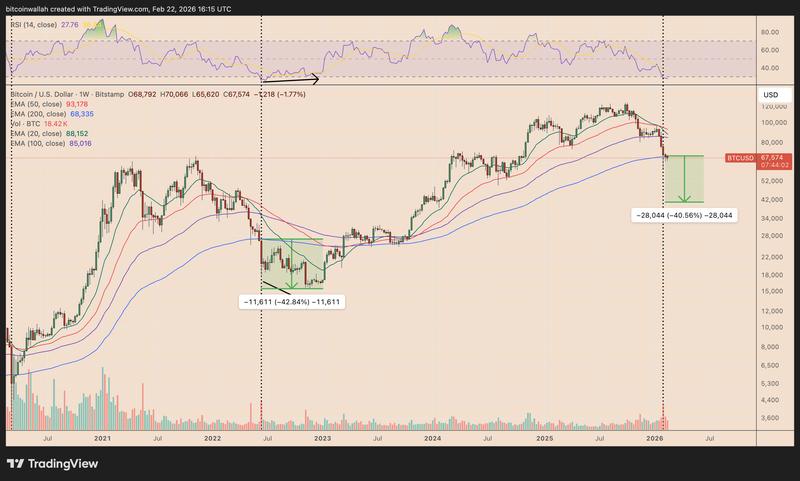
If that 40% decline repeats itself in 2026, it would place BTC prices around the $40,000 mark, representing 60% below its all-time high of around $126,270.
Several analysts, including those at Kaiko, also anticipate BTC potentially finding a floor near $40,000–$50,000 according to its "four-year cycle" analytical framework.