
BTC Could Reach $72K If V-Shaped Chart Pattern Successfully Completes
Following positive CPI data, Bitcoin's surge past $69,000 may finalize a V-shaped chart recovery pattern while validating $60,000 as the correction's lowest point.

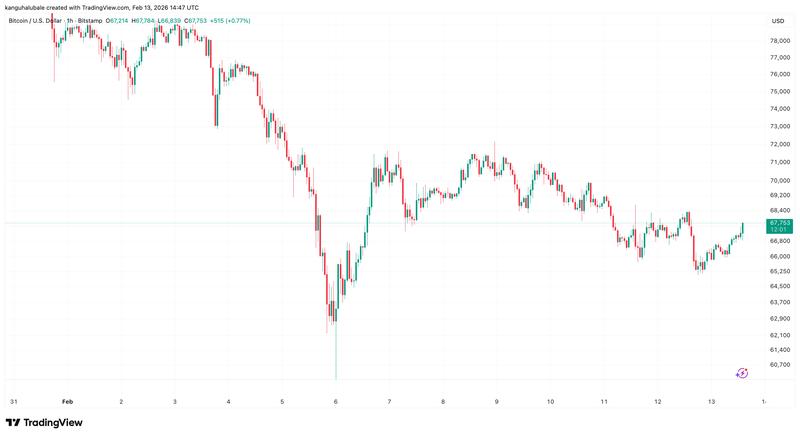
On Friday, Bitcoin (BTC) surged past the $69,000 mark following the release of US CPI data that revealed declining inflation rates, sparking optimism among traders regarding a potential near-term recovery in BTC prices.
Key takeaways:
- Market participants are optimistic about a near-term relief rally for BTC prices, though bullish momentum requires breaking through the $68,000 to $70,000 resistance zone first.
- According to Bitcoin market forecasts, a successful confirmation of $65,000 as a support level could trigger a short squeeze that propels prices toward $80,000.
Bitcoin price must take out resistance at $68,000
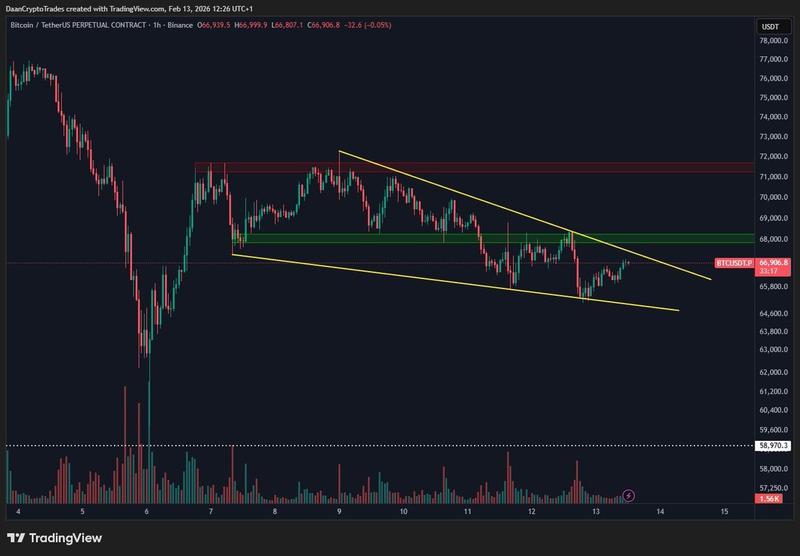
During Thursday's trading session, Bitcoin made an attempt to break through resistance levels but "got slammed back down at the $68K level," according to analyst Daan Crypto Trades in a Friday post on X, adding:
"That's the area to watch if BTC wants to see another leg up at some point."
A chart included with the analysis demonstrated that the BTC/USD pair was trading within the confines of a falling wedge pattern on the one-hour timeframe.
According to this technical pattern, a near-term advance toward $72,000 is expected following a decisive break above the wedge's resistance trendline positioned at $68,000.
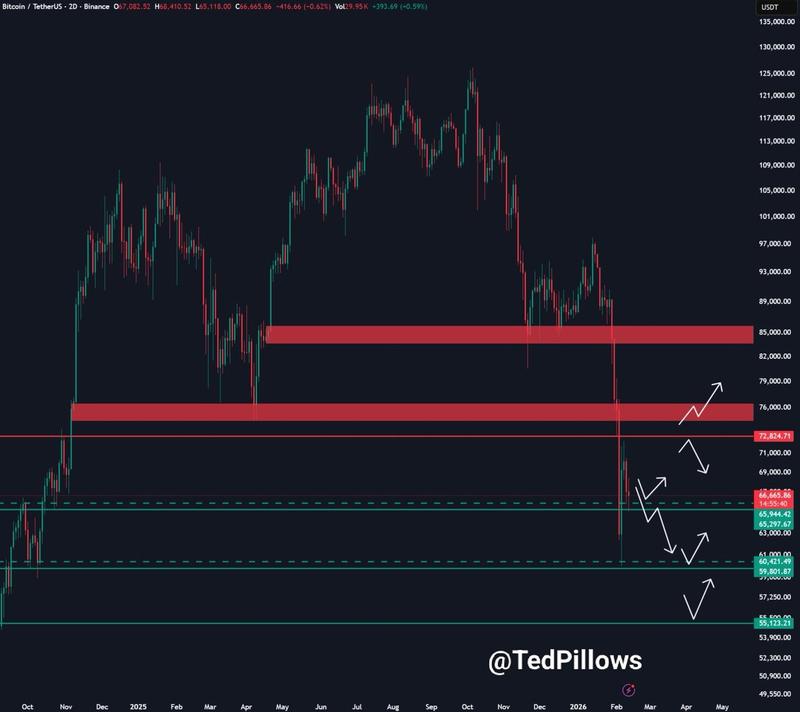
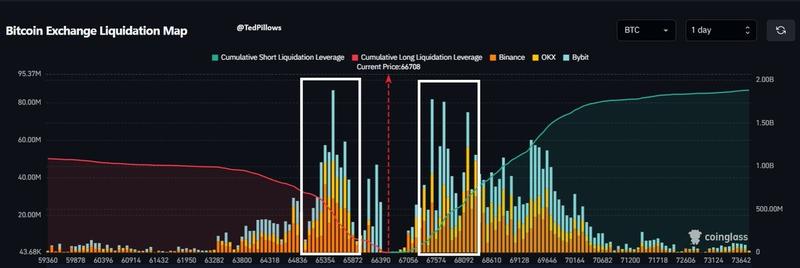
Another analyst, Ted Pillows, noted that the "chances of a deeper correction would increase" if the $65,000-$66,000 support does not hold.
"To the upside, if Bitcoin reclaims the $70,000 level, it could rally 8%-10% really quickly."
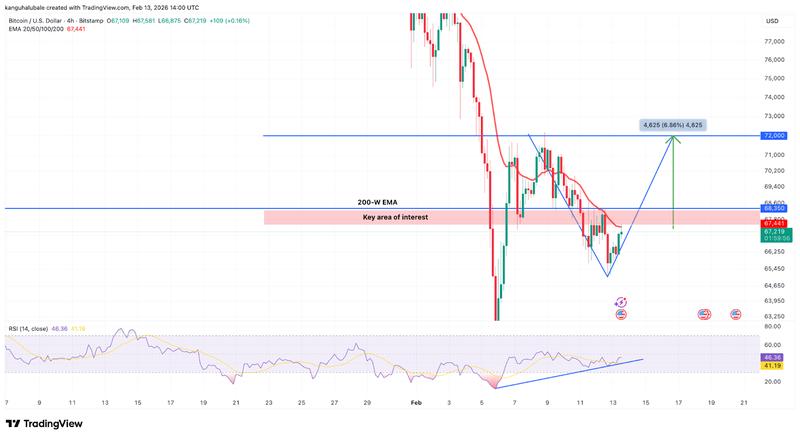
Examining the technical landscape, BTC's recent price movements have been developing a V-shaped recovery pattern on the four-hour timeframe, as illustrated in the chart below.
Currently, the BTC/USD pair is testing a crucial resistance zone marked by the 20-period EMA positioned at $67,500 alongside the 200-week exponential moving average (EMA) located at $68,000.
For bullish continuation, traders need to drive prices above this critical level to improve the probability of an advance toward the pattern's neckline resistance at $72,000.
According to previous Cointelegraph coverage, a successful breach of $72,000 would reignite expectations for a recovery extending toward the 20-day EMA positioned at $76,000, and ultimately the 50-day simple moving average situated above $85,000, representing potential cumulative gains of 26%.
Liquidation risk builds near $80,000
Data examining exchange order-book liquidity from CoinGlass revealed Bitcoin's current price positioned beneath two significant ask walls concentrated just under $75,000 and surrounding the $80,000 level.
"$BTC liquidations are stacking well above $72K, and around the area from $77K to $80K," Bitcoin analyst ZordXBT said in his latest post on X.
Underneath the current market price, bid orders were positioned down to $64,500, "where I have my limit orders placed," the analyst said, adding:
"If the market holds itself here, it can very easily eat those liquidity bubbles."
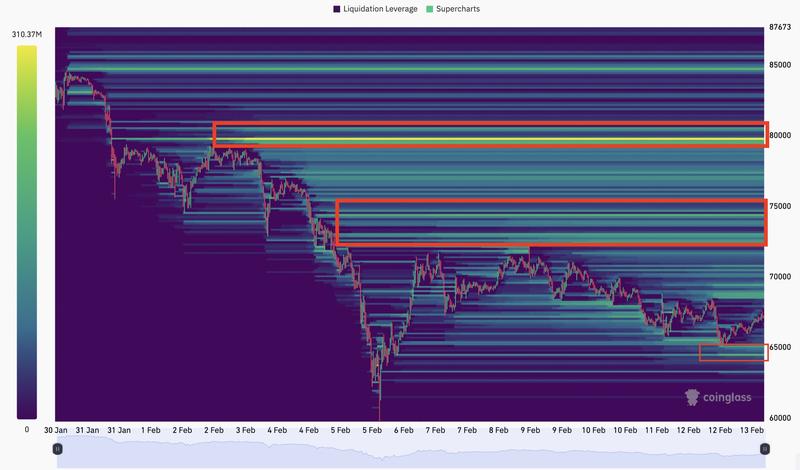
The liquidation heatmap displayed above indicates that a successful break of the $72,000-$75,000 range could initiate a cascade of liquidations, compelling bearish traders to exit their positions and potentially propelling prices toward $80,000, where the subsequent major concentration of liquidity awaits.
Taking a closer look, Ted Pillows identified substantial bid accumulations at $65,000 alongside concentrated ask orders near $68,000, suggesting that price action is likely to test these zones to absorb available liquidity.
"I think a revisit of $65,000 and a pump to $68,000 will both happen soon."
This article does not contain investment advice or recommendations. Every investment and trading move involves risk, and readers should conduct their own research when making a decision. While we strive to provide accurate and timely information, Cointelegraph does not guarantee the accuracy, completeness, or reliability of any information in this article. This article may contain forward-looking statements that are subject to risks and uncertainties. Cointelegraph will not be liable for any loss or damage arising from your reliance on this information.