
Bitcoin Approaches Complete Capitulation: Three Critical Indicators
A combination of short-term investors' panic-driven selloff, widespread extreme fear sentiment, and deeply oversold RSI levels indicate that Bitcoin may be approaching its final capitulation stage.
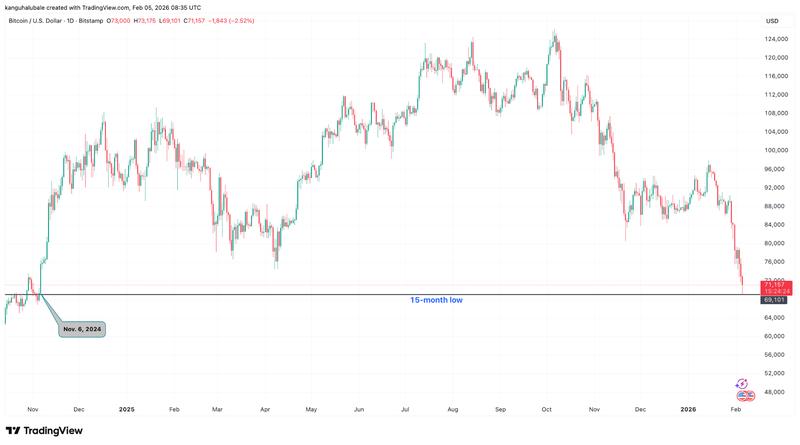
On Thursday, Bitcoin (BTC) witnessed a resurgence of selling pressure as prices fell beneath the $69,000 threshold, marking the cryptocurrency's weakest performance since November 6, 2024.
Market observers noted that Bitcoin is displaying characteristics of "full capitulation" alongside signs of a possible bottom formation, driven by widespread market fear, distressed selling from short-term holders, and the relative strength index (RSI) readings.
Key takeaways:
- Investors holding Bitcoin short-term have offloaded approximately 60,000 BTC within a 24-hour period.
- Readings from the Crypto Fear & Greed index indicate "extreme fear," which historically suggests a market bottom may be forming.
- The "most oversold" condition shown by Bitcoin's RSI indicates seller exhaustion is underway.
Capitulation among short-term holders intensifies
Approximately 60,000 BTC, representing roughly $4.2 billion based on prevailing market rates, belonging to short-term holders (STHs)—defined as investors who have maintained positions for fewer than 155 days—were transferred to exchanges at a realized loss during the previous 24-hour period, based on information from CryptoQuant.
This represented the most substantial exchange inflow recorded so far this year, adding to the prevailing selling pressure in the market.
"The severity of this correction is evident in the fact that long-term holders aren't moving any BTC that's currently in profit," stated CryptoQuant analyst Darkfost in an X platform post, further noting:
"This is a full capitulation."

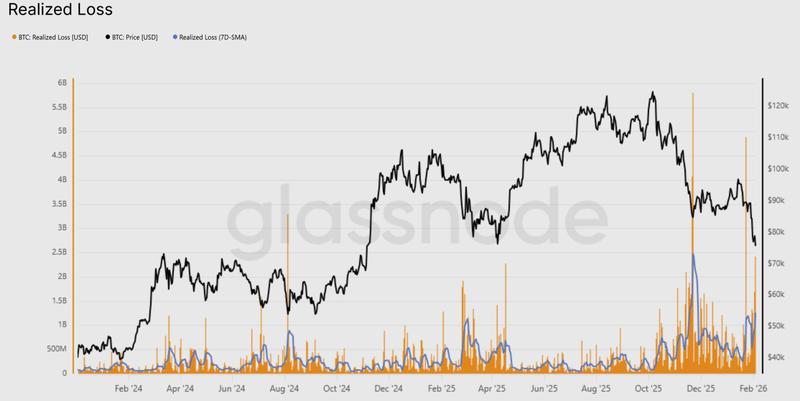
Upon examining the volume of coins being sold at a loss, Glassnode's analysis revealed that the 7-day simple moving average of realized losses has climbed beyond $1.26 billion daily.
This data point indicates a "marked increase in fear," according to Glassnode, which elaborated:
"Historically, spikes in realized losses often coincide with moments of acute seller exhaustion, where marginal sell pressure begins to fade."
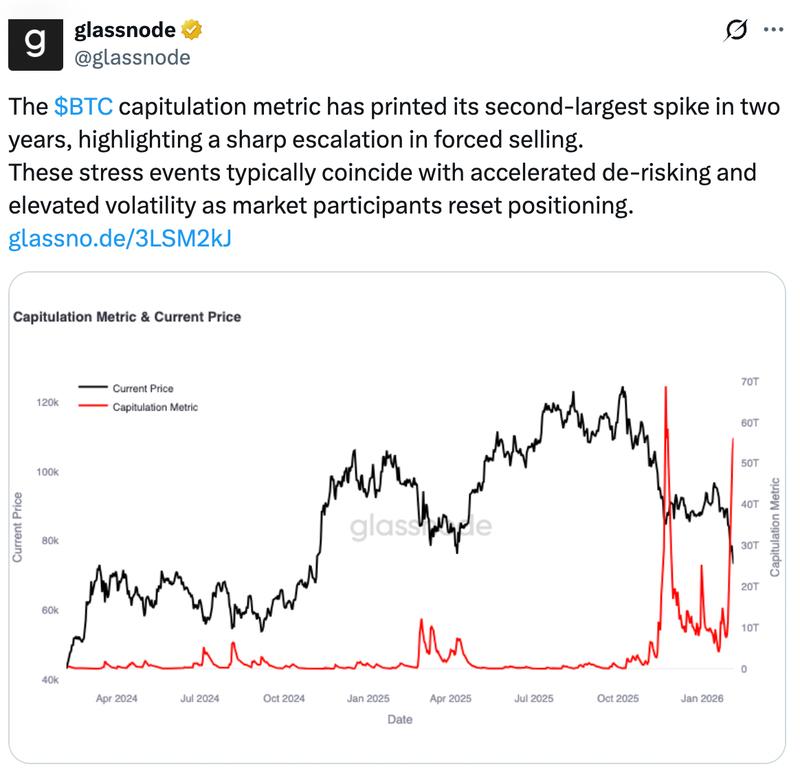
Additionally, Bitcoin's capitulation metric has "printed its second-largest spike in two years," instances that have historically aligned with accelerated de-risking and elevated volatility as market participants reset positioning," Glassnode noted.
Market bottom potentially indicated by "extreme fear"
On Thursday, the Crypto Fear & Greed Index, a gauge that tracks overall sentiment across the cryptocurrency market, registered an "extreme fear" reading of 12.
Such extreme readings were previously observed on July 22, several months prior to Bitcoin's price reaching a bottom at $15,500 before initiating a sustained bull run.
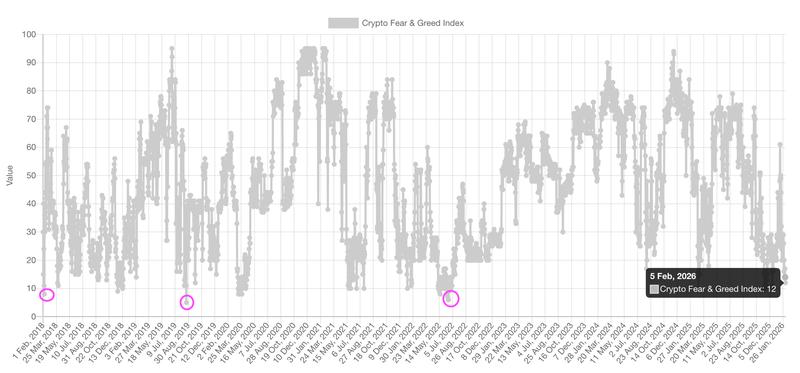
Historical data demonstrates that during all capitulation scenarios where the index reached this extreme threshold, short-term price weakness was typical, yet nearly every instance ultimately resulted in a rebound.
"We've reached an 'extreme fear' level with the Crypto Fear and Greed Index standing at 11," analyst Davie Satoshi remarked in a Thursday X post, continuing:
"History has shown this is the time to buy and accumulate more!"
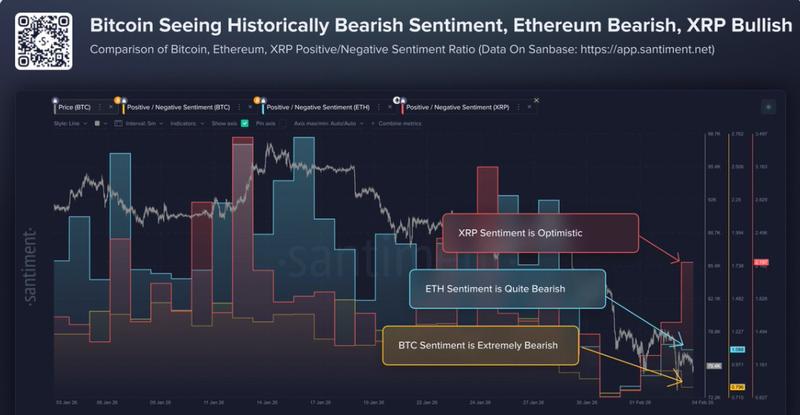
In a Thursday X post, cryptocurrency sentiment platform Santiment indicated that investor sentiment has "turned extremely bearish toward Bitcoin."
"This remains a strong argument for a short-term relief rally as long as the small trader crowd continues to show disbelief toward cryptocurrency as a whole."
Seller exhaustion indicated by Bitcoin's "most oversold" RSI
Analysis from CoinGlass' heatmap reveals that BTC's RSI is currently showing oversold conditions across five of six different time frames examined.
Bitcoin's RSI currently stands at 18 on the 12-hour timeframe, 20 when viewing the daily chart, and 23 on the four-hour interval. Additional time periods similarly show oversold or nearly oversold RSI readings, including 30 and 31 on the weekly and hourly timeframes, respectively.
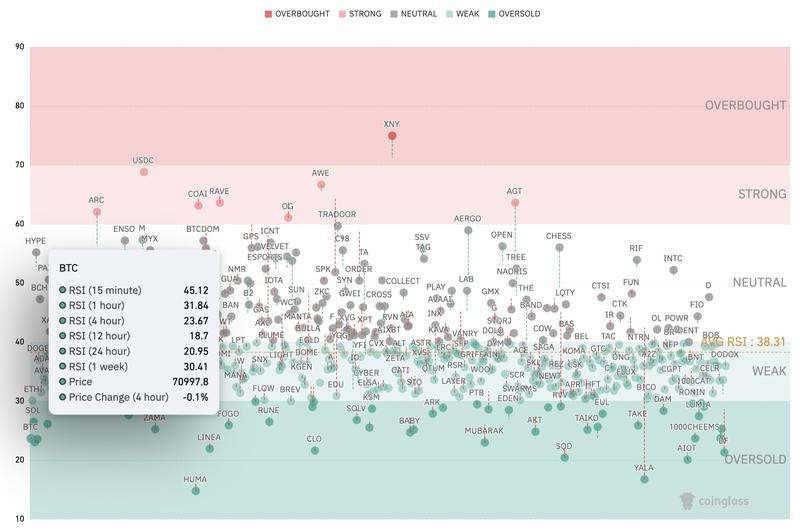
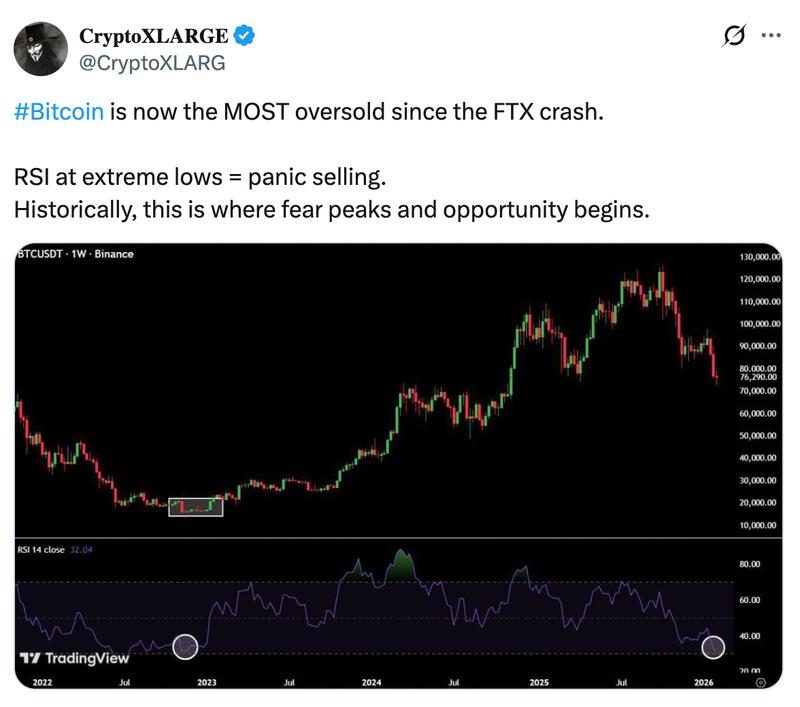
Indeed, information sourced from TradingView demonstrates that the weekly RSI registered 29 on Thursday, representing the "most oversold" reading observed since the bear market of 2022, market analysts confirm.
"Bitcoin has reached its MOST oversold level since the FTX crash," CryptoXLARGE wrote in a Wednesday X post, noting that this reflects panic-driven selling behavior among market participants.
"Historically, this is where fear peaks and opportunity begins."
Bitcoin's RSI has reached the identical oversold levels previously witnessed around the $16K mark in 2022, a period that represented the "last major capitulation," phase, analyst HodlFM explained in a recent X platform post, adding:
"Not a timing signal by itself, but historically, this is where risk/reward favors the buyers."