
Analysts Eye $50K Bitcoin Target Following 6% Daily Price Plunge
BTC drops to levels not seen since early April amid widespread selling pressure, prompting analysts to forecast potential return to $50,000 price points.

Following the opening of Wednesday's Wall Street trading session, Bitcoin (BTC) witnessed losses exceeding 6% as a wave of forced liquidations intensified.
Key points:
- BTC slips beneath the $67,000 threshold for the first time since early April as selling pressure intensifies.
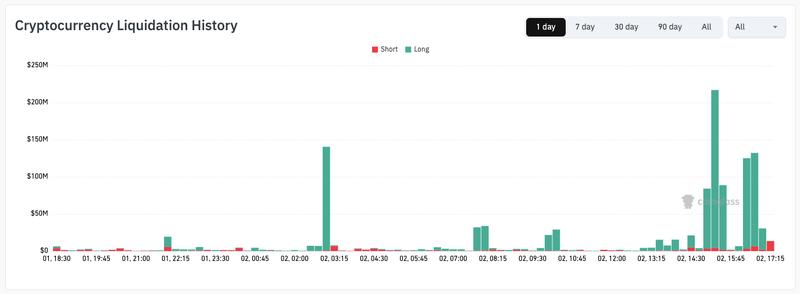
- Over a 24-hour period, liquidations reach $1.25 billion while technical analysts predict a potential drop to the mid-$50,000 zone.
- The BTC/USD pair seems to be replicating a bear flag breakdown pattern observed earlier this year.
BTC price plummets to $66,950 amid liquidation wave
According to TradingView data, the BTC/USD trading pair descended to a low of $66,948 on the Bitstamp exchange.
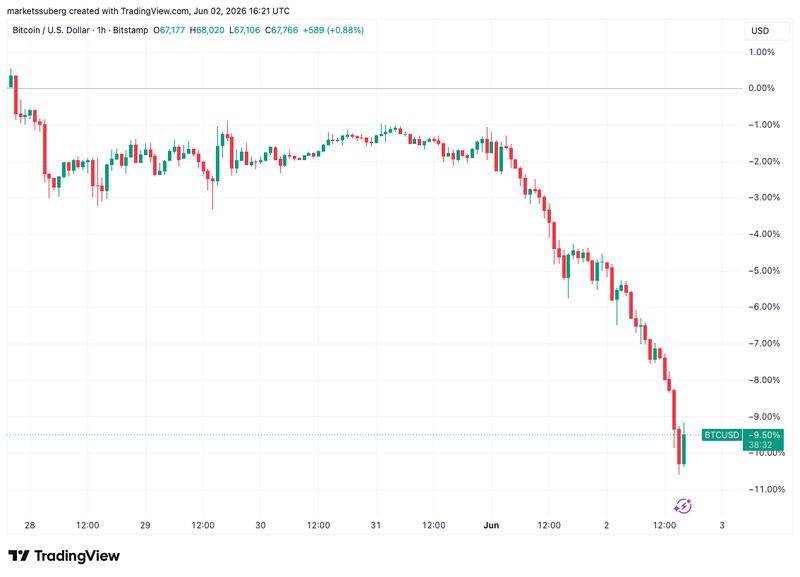
This price point represented the pair's weakest position since April 5, wiping out several months' worth of accumulated gains while cross-crypto liquidations totaled $1.25 billion over the preceding 24 hours.
Extending a troubling disconnect from traditional risk assets, Bitcoin plummeted even as the S&P 500 index reached a fresh all-time high.
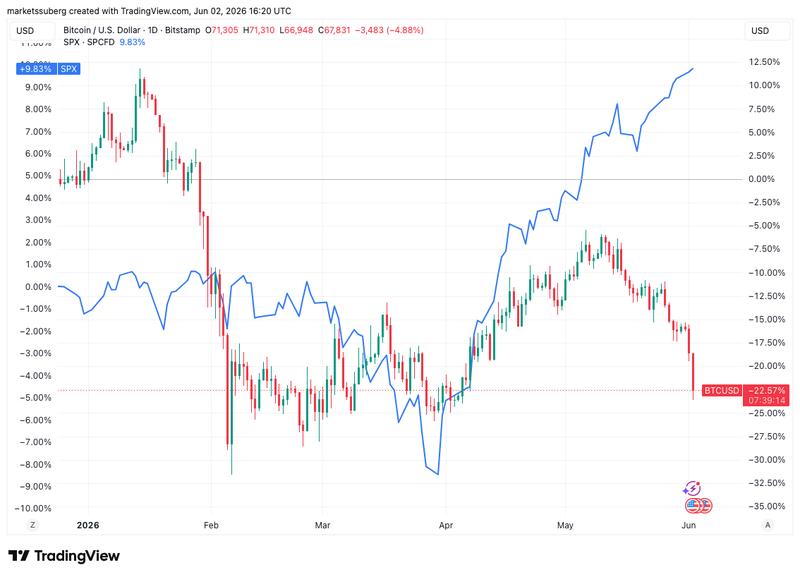
"Investors are Macro Risk-Off, fleeing into Stablecoins and moving away from Bitcoin," trader and analyst Rekt Capital wrote in a response on X.
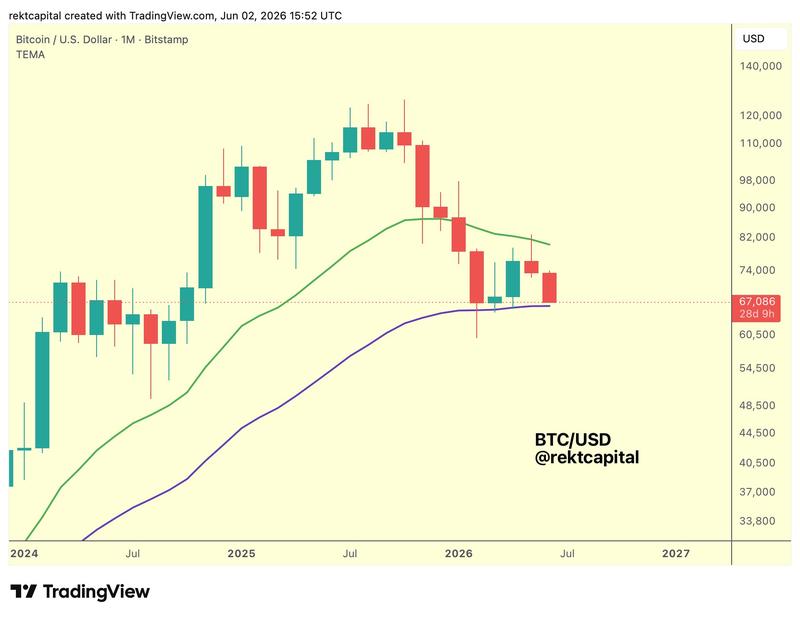
According to Rekt Capital's analysis, the next price objective would be the 50-month exponential moving average (EMA) positioned at $66,250.
"There could be a limited reaction from there on contact but over time Bitcoin is likely to breakdown from this EMA and continue macro downside in this Bear Market," he added.
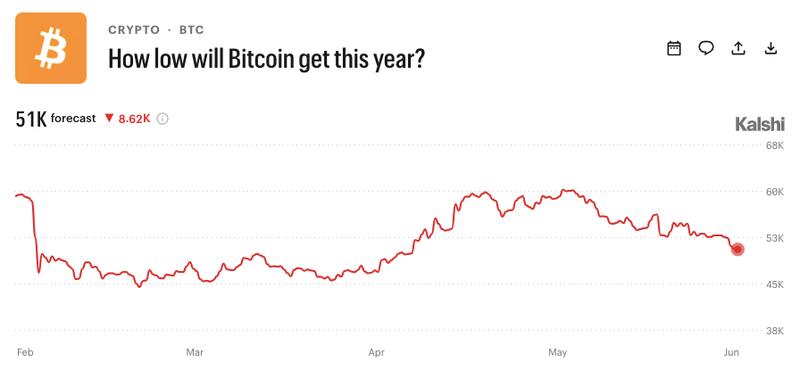
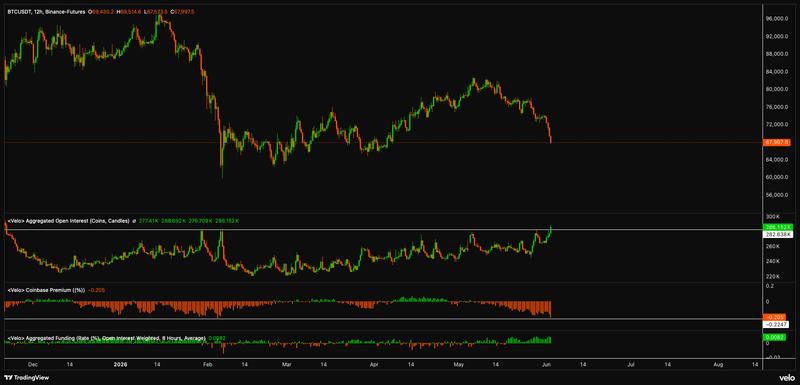
While prediction platform Kalshi indicated $50,000 could be back in play, market commentator Exitpump highlighted unprecedented open interest levels contributing to an "insane amount of spot selling."
"I think this can end with a big red candle wiping out all the underwater longs from the system," it warned X followers.
"Maybe we hit low 60Ks or even mid 50Ks."
Bear flag pattern reemerges as key Bitcoin indicator
Meanwhile, CollinTalksCrypto, creator of the social media channel of the same name, brought back a familiar chart feature to explain the BTC price weakness.
According to his analysis, BTC/USD was merely extending a prior breakdown pattern after breaking out of a bear flag formation.
"Many wanted to overcomplicate this with 'this time is different,' but bitcoin is just doing the same thing it always does in bear markets. It breaks down," an X post read.
"And it definitely takes longer than 4 months (Oct->Feb $60k), despite the hopium to want otherwise. I think it's more likely than many still want to admit that we see lower lows this year."
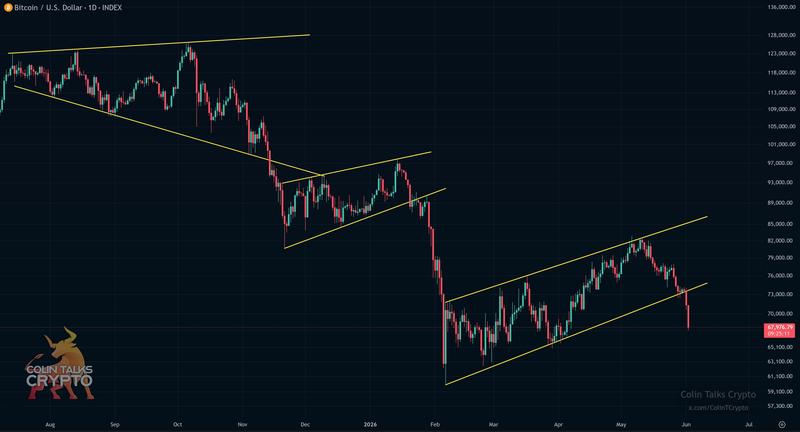
The BTC price chart was characterized as "pretty straightforward" by ColinTalksCrypto.