Analyst identifies 'strongest case' for Bitcoin buying despite near-term price decline risks
Bitcoin's historically low RSI metrics combined with whale buying patterns signal a once-in-a-generation accumulation opportunity, though experts anticipate BTC could drop beneath $60,000.

The relative strength index (RSI) for Bitcoin (BTC) has reached unprecedented lows on both daily and two-week timeframes, occurring simultaneously with persistent accumulation patterns among multiple investor categories, reinforcing what one market expert described as the "best thesis" for purchasing BTC.
According to onchain analytics, wallets containing 1,000–10,000 BTC have accumulated over 53,000 BTC throughout the last 60 days, with retail participants of smaller sizes similarly expanding their positions.
Key investor groups show increased BTC accumulation
Michael van de Poppe, founder of MN Capital, emphasized Bitcoin's historically depressed momentum indicators as representing a possible long-term entry point.
"The lowest Bitcoin read on the 2-Week RSI, and Daily RSI EVER. That's the best thesis for accumulating and buying your Bitcoin," van de Poppe said, noting that the fear-driven liquidations may persist while simultaneously offering uncommon buying chances.
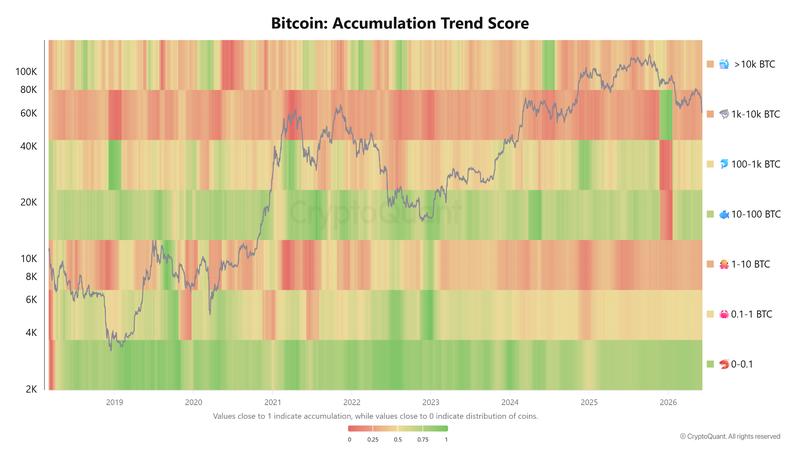
Blockchain data validates portions of this perspective. According to Glassnode's Accumulation Trend Score, the most robust purchasing behavior is visible among retail holders and specific medium-sized wallet owners. Wallets containing less than 0.1 BTC achieved a score of 0.78, representing the highest reading across all monitored categories. The cohort holding 10–100 BTC came next with a score of 0.71, indicating persistent accumulation throughout recent periods.
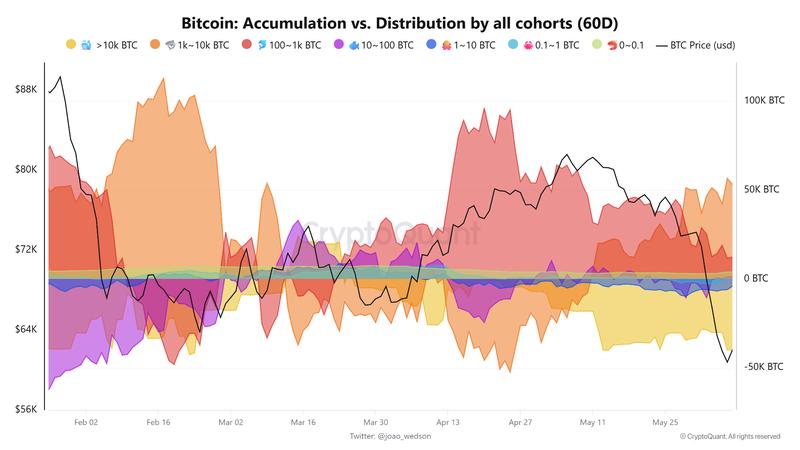
Certain whale-tier holders have similarly demonstrated active purchasing behavior. Throughout the previous 60 days, addresses containing 1,000–10,000 BTC accumulated 53,042 BTC, representing the most substantial gain across all wallet categories. Wallets holding 100–1,000 BTC added an additional 12,233 BTC, whereas the 10–100 BTC category accumulated 1,283 BTC.
Conversely, a contrasting trend appeared among the most substantial entities. Wallets containing more than 10,000 BTC decreased their balances by 39,840 BTC throughout the identical timeframe. Smaller categories holding between 1 and 10 BTC likewise reduced their exposure. This divergent positioning indicates continuing demand from whales positioned below the largest tier and from retail participants accumulating during price weakness.
Experts identify potential bottom areas beneath $60,000
Titan of Crypto, a market analyst, identified a quarterly fair value gap (FVG) spanning from $56,800 to $44,600. A fair value gap represents a price inefficiency generated when Bitcoin experiences rapid directional movement within a compressed timeframe, creating a zone characterized by comparatively minimal trading volume.
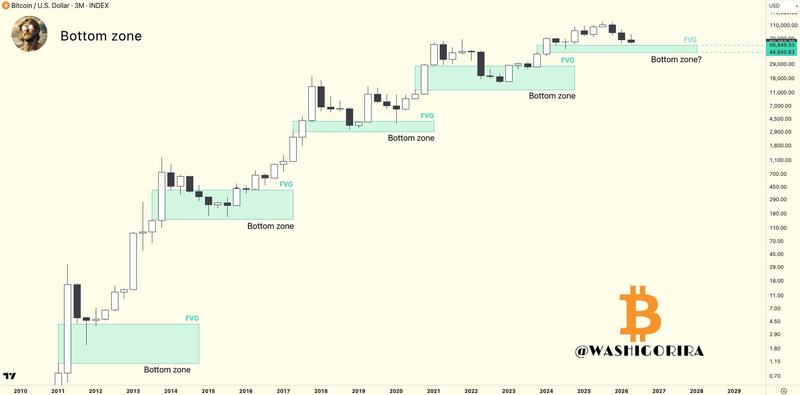
Analysis of the quarterly timeframe reveals that Bitcoin has historically returned to comparable inefficiency zones formed during 2011, 2013, 2017, and 2020 prior to forming a market bottom. The most recent gap, which originated in 2024, has yet to be filled, establishing the $56,800–$44,600 zone as a significant range should the ongoing pullback deepen further.
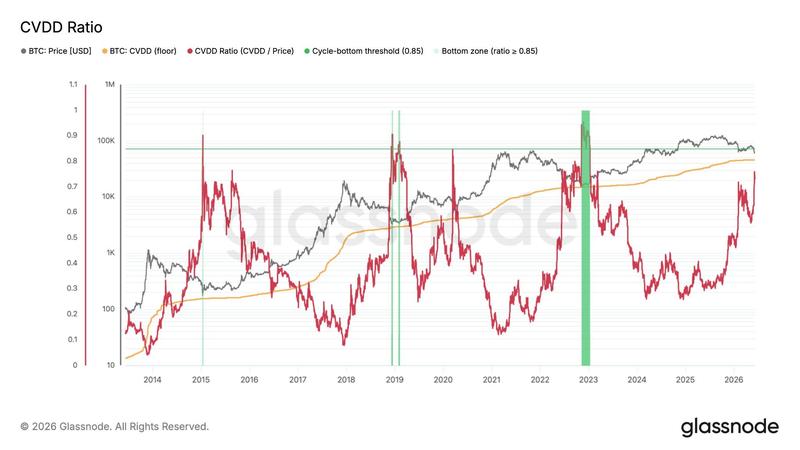
Separately, Glassnode co-founder Rafael drew attention to Bitcoin's cumulative value days destroyed-to-price ratio (CVDD), a long-horizon valuation instrument that correlates current market value against a historical cost foundation derived from coin-age dynamics. This ratio presently hovers around 0.73 and has traditionally moved toward 1.0 during significant cycle troughs.
Given the CVDD floor is positioned near $46,000, Rafael indicated that a comparable behavioral pattern would suggest a probable bottom within the $52,000–$59,000 territory.