
Historical Data Shows 655% BTC Surge After Supply in Profit Metric Hit 50% Threshold
When Bitcoin's supply in profit indicator dipped beneath the 50% mark in February, it echoed patterns from earlier accumulation periods. Can historical data signal another major rally ahead?

As of Thursday, the percentage of Bitcoin (BTC) supply currently in profit sits at 60.6%, maintaining its position within a range that has historically signaled major market cycle transitions. This key indicator reached a low of 50.8% on Feb. 5, marking its weakest point since January 2, 2023, which meant a significant portion of Bitcoin holders were either breaking even or experiencing losses on their positions.
Historical market cycles reveal that comparable conditions have frequently occurred just before substantial bullish price movements. Back in January 2023, when profitability metrics showed a similar reading of 51%, BTC was valued at $16,682, which was followed by an explosive 655% surge that propelled the cryptocurrency to $126,000 in 2025.
Another comparable scenario unfolded in March 2020, during which the total supply in profit metric dipped beneath the 50% threshold while BTC was priced at $6,500, setting the stage for its eventual climb to $69,000 in 2021.
Bitcoin profitability returns to prior market cycle base levels
Throughout the last five years, the profitability zone ranging from 50% to 60% has consistently identified phases where a substantial segment of market participants held positions close to their Bitcoin acquisition cost. This dynamic compresses the unrealized profits distributed across the entire network and diminishes the motivation for investors to liquidate their holdings during market downturns.
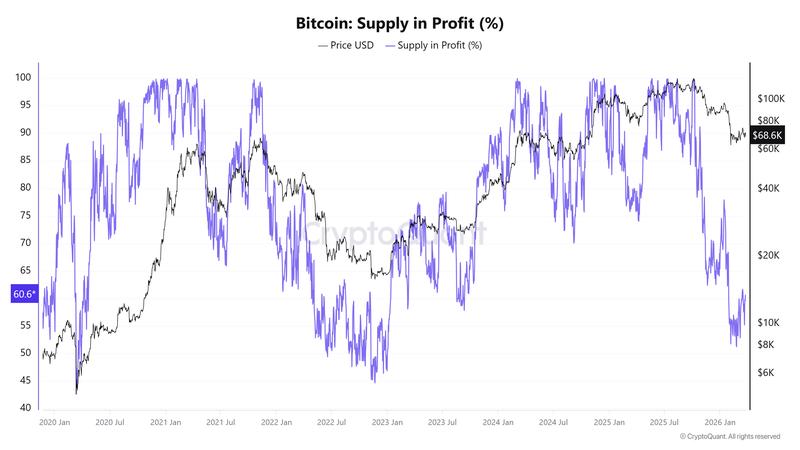
It should be emphasized that this particular metric does not serve as a precise indicator for identifying price bottoms. Rather, it identifies a territory where historical accumulation by long-term investors has yielded substantial gains over time, while simultaneously experiencing a reduction in selling pressure from those holding losing positions.
Historical market cycles demonstrate that Bitcoin price floors were established when the long-term holder net unrealized profit/loss (LTH-NUPL) moved into negative territory, which was observable during the bear markets of 2015, 2018, and 2022. These periods were characterized by long-term investors maintaining positions that showed unrealized losses.
In contrast, the present LTH-NUPL measurement stands at approximately 0.40, indicating that long-term holders continue to maintain healthy profit margins, despite the fact that overall supply profitability has declined to levels typically associated with market cycle bottoms.
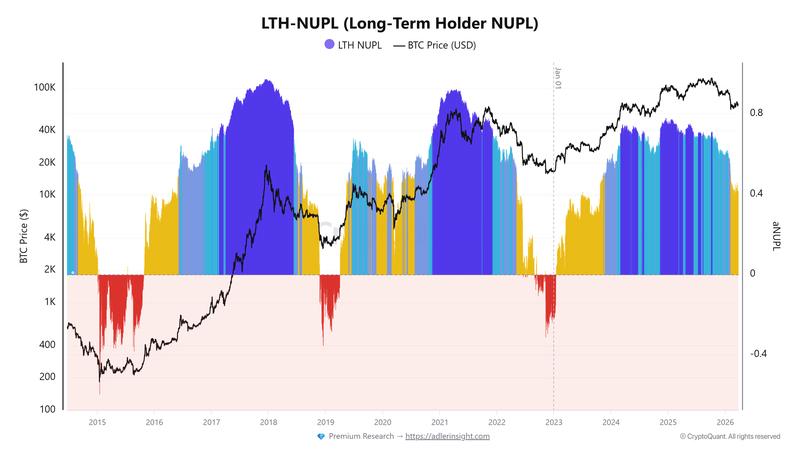
This divergence underscores a fundamental transformation in the overall market structure. An increasing proportion of the Bitcoin supply is currently held by institutional entities and spot exchange-traded funds (ETFs), which together account for nearly 15.8% of the total circulating supply, representing 3,319,677 BTC.
These institutional market participants generally maintain extended holding timeframes and demonstrate reduced responsiveness to short-term price volatility.
Consequently, the compression of profitability metrics across the BTC marketplace does not result in the same magnitude of forced liquidations from long-term holders that characterized earlier market cycles during 2015, 2018, and 2022.
This structural evolution provides clarity on why the overall supply in profit indicator can return to historical accumulation territories even as long-term holder profitability metrics remain at elevated levels.
BTC exchange flows align with valuation models
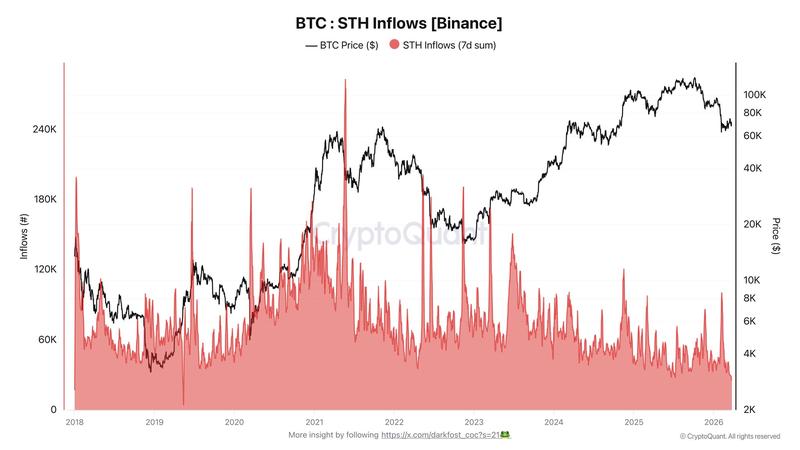
Exchange flow data reveals that short-term holder BTC deposits to Binance decreased to 25,000 BTC on March 25. According to crypto analyst Darkfost, this represents a new market low, declining sharply from approximately 100,000 BTC observed during the sell-off period in early February. This significant reduction demonstrates a notable decrease in panic selling activity among newer market entrants.
Separately, crypto analyst GugaOnChain pointed out that various valuation frameworks can assist in determining where more significant market distress might materialize for BTC. Key indicators including market-value to realized-value (MVRV) falling below 1, NUPL dropping under -0.2, and a Puell Multiple approaching 0.35 have historically emerged during phases characterized by intense retail capitulation and undervalued market conditions.
Although these technical indicators cannot precisely forecast exact market bottoms, they successfully identify zones where historical downside risk has been constrained relative to potential long-term appreciation, providing investors with enhanced perspective on comprehensive market positioning.