BTC surrenders recent rally as $85K resistance strengthened by long-term holders
BTC continues trading within a confined range as long-term holder positions and exchange liquidity walls strengthen the $85,000 resistance level.

Bitcoin (BTC) relinquished its recent upward momentum following the opening of Tuesday's Wall Street session as bond yields in the United States continued climbing to levels not seen in several decades.
Key points:
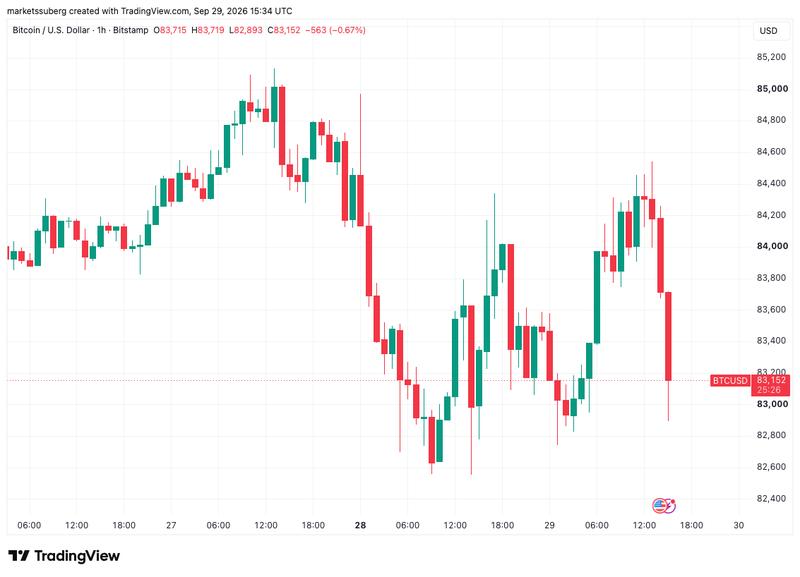
- Bitcoin gave up a short-term bounce after touching $84,450, falling back under the $83,000 threshold.
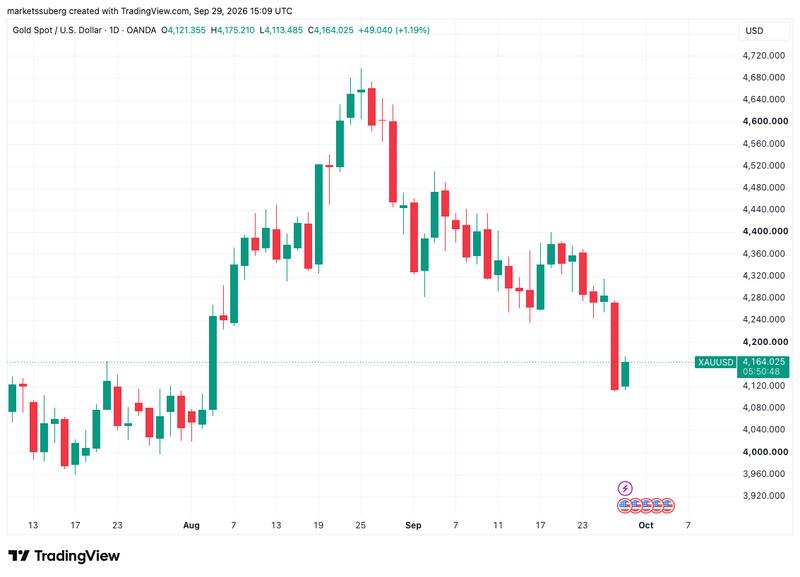
- Bond yields in the US established fresh multidecade peaks on Tuesday while gold attempted to claw back from a 3.6% decline to $4,115 per ounce.
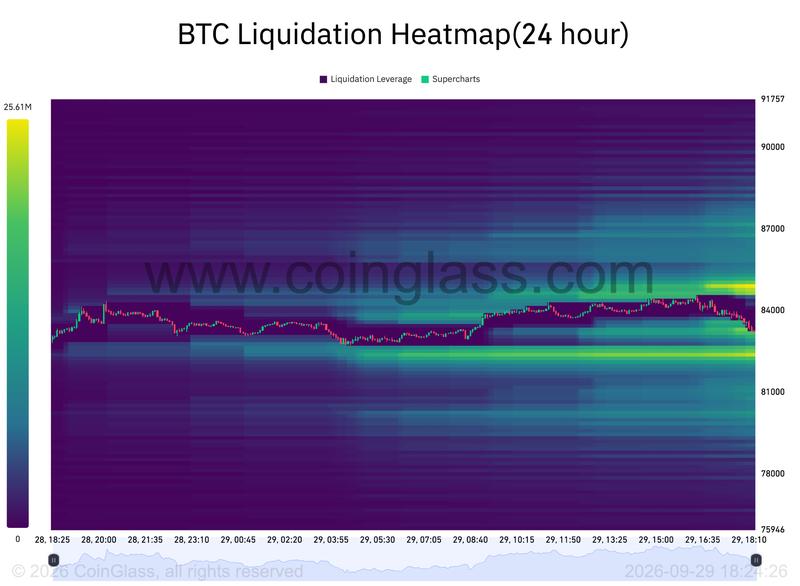
- Sell-side liquidity continued solidifying above current market prices around the $85,000 level on trading platform order books.
Bitcoin faces rejection approaching $85,000 amid ongoing bond-yield surge
Information from TradingView revealed a temporary climb to $84,540 losing momentum at the start of the American trading day, with BTC/USD pulling back beneath its daily opening price near $83,600.
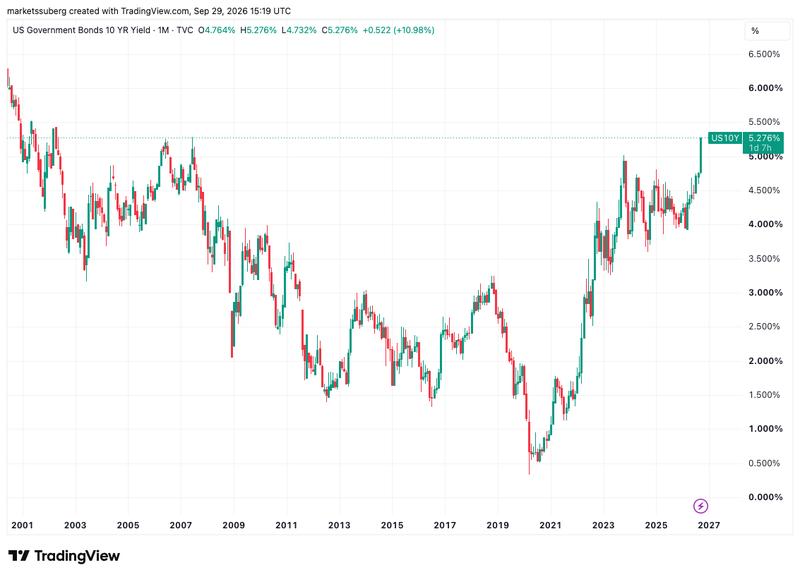
Bond trading in the United States displayed no indications of slowing throughout the day, with the 30-year yield climbing to fresh 24-year peaks above 5.60% while the 10-year yield reached 5.26%, approaching its June 2007 peak to territory last observed in April 2002.
Uncertainty surrounding geopolitics related to the US-Iran war, elevated oil prices and continuing inflationary pressures maintained investor wariness, while the surge in bond yields simultaneously pushed precious metals downward. Gold experienced a 3.6% drop on Monday to $4,115 per ounce before recovering to $4,166 at the time of writing.
Financial analyst The Kobeissi Letter characterized gold's movement as "highly unusual."
The surge in yields is creating an extraordinary disruption across the precious metals market.
While equity markets in the US steered clear of significant volatility, fresh analysis from market intelligence firm Mosaic Asset Company identified potential for renewed gains amid "extremely oversold" market conditions.
On a year-to-date basis, the percent of stocks trading in short-term uptrends has only been this low back in late March when the S&P fell near correction territory. Many other measures of breadth show the presence of an oversold condition while investor sentiment has seen a large jump in bearish views over the past two weeks.
Mosaic further noted that strong economic indicators, including job gains in August that exceeded expectations, could underpin additional stock market advances even as the Federal Reserve increases interest rates. As Cointelegraph reported, markets expect the Fed to hike rates by 0.25% at its October meeting.
Long-term holder supply reinforces overhead resistance
Across shorter timeframes, Bitcoin continued operating under the pressure of shifting liquidity dynamics on exchange order books.
Information from CoinGlass demonstrated sell-side resistance intensifying at the $85,000 level throughout the day, with prices declining in response — a pattern mirroring activity observed at the beginning of the week.
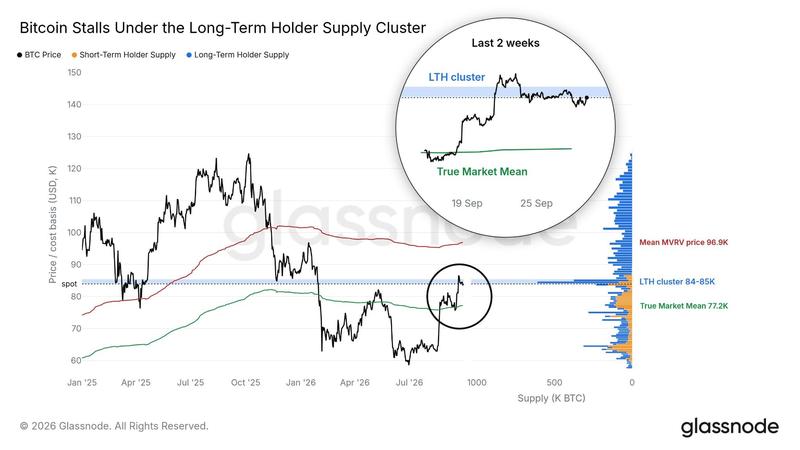
Blockchain data provider Glassnode highlighted that cryptocurrency holdings belonging to long-term holders (LTHs) — addresses maintaining a UTXO for at least six months without selling — were concentrated around the $85,000 price point, elevating the probability of profit-taking should Bitcoin seek to push beyond that threshold.
$BTC has stalled under its heaviest supply cluster. More long-term holder coins sit at 84k–85k than at any other price on the chart. Price needs to break through and hold above this level for the rally to continue.