
Bitcoin surge past $78K triggers $820M in crypto liquidations
Leveraged cryptocurrency traders saw close to one billion dollars in positions wiped out during the last 24 hours while Bitcoin's price surged beyond the $78,000 mark.

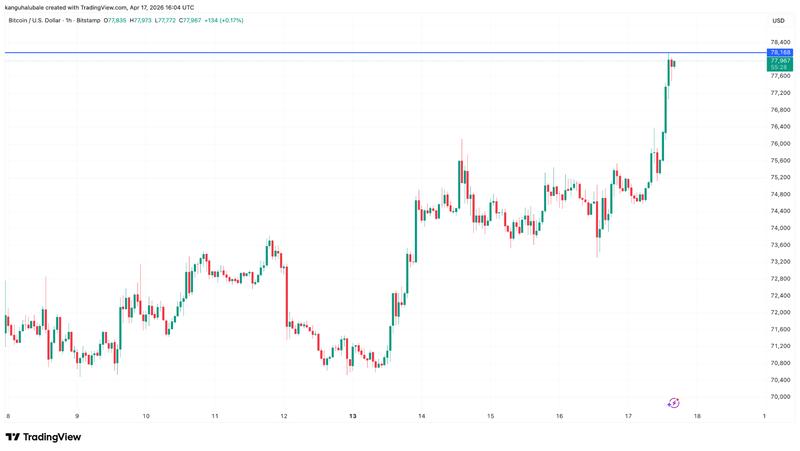
On Friday, Bitcoin (BTC) surged past the $78,000 threshold, reaching a new 10-week peak as cryptocurrency and stock markets responded positively to diminishing tensions surrounding the US and Israel's conflict with Iran. This breakout above previous range resistance levels triggered substantial liquidations across leveraged Bitcoin trading positions.
Short positions worth over $660 million were liquidated, with Bitcoin representing $353 million of this figure. Ether (ETH) came in second with $160 million in liquidated short positions.
In total, the futures market experienced $826 million in liquidations throughout the previous 24-hour period.
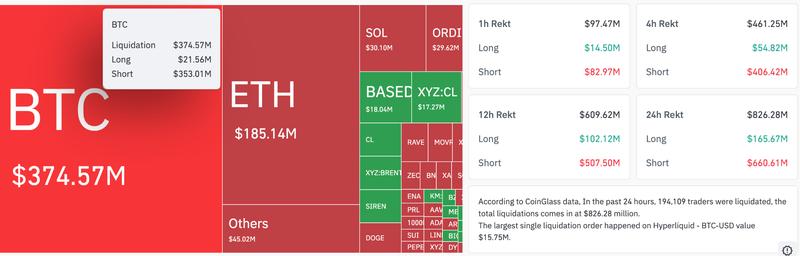
The largest individual liquidation took place on the Hyperliquid platform, where a BTC-USDT short position valued at $15.75 million was forcibly closed.
When large groups of short positions get liquidated, they tend to magnify the momentum of asset price increases, and information from CoinGlass revealed that Bitcoin's total futures open interest (OI) climbed by 13% during the past 24 hours.
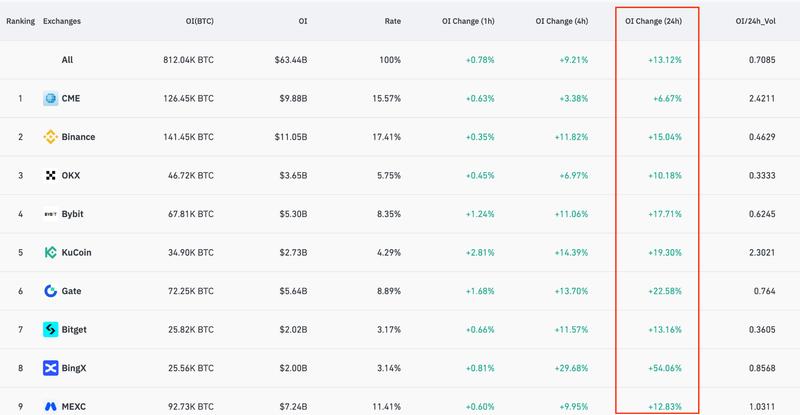
Despite the fact that futures longs (buyers) and shorts (sellers) must always be balanced, increasing OI indicates higher leverage usage and market participation, which in this instance seems to favor bullish traders.
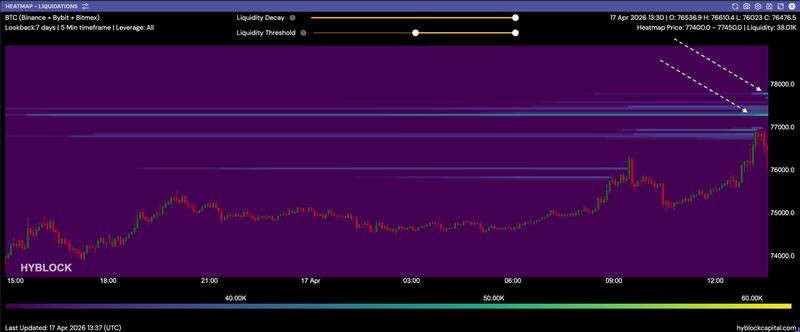
Information from Hyblock demonstrated that ask liquidity positioned between $77,500 and $78,000 was consumed as BTC climbed to its Friday intra-day peak levels.
Bitcoin MACD forecasts a "big move"
A buy signal has been generated by Bitcoin's moving average convergence divergence (MACD) indicator on its weekly timeframe, representing a formation that has traditionally come before significant price surges.
Technical analysts frequently utilize the MACD, a widely recognized momentum indicator, to help traders determine the intensity, trajectory and longevity of trends in an asset's price movement.
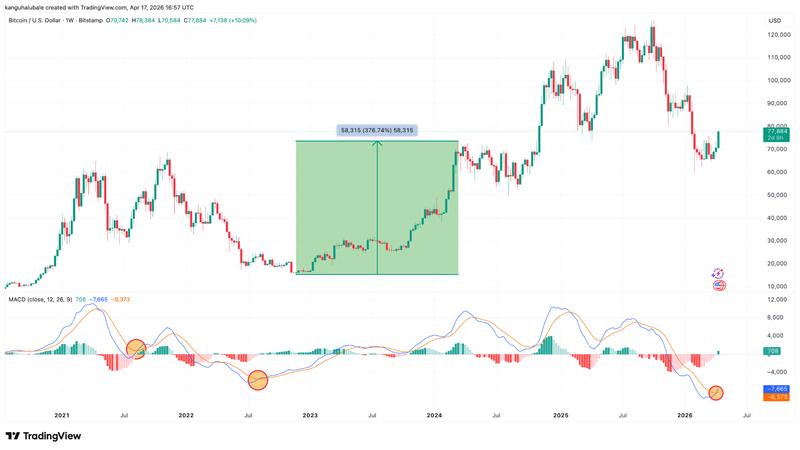
As illustrated in the chart below, the indicator dropped to its historically lowest point and has now created a bullish crossover on the weekly timeframe.
"Not only do we have a 1W MACD bullish cross and break of trend, we have it from the lowest point the MACD has ever dropped to," analyst Sykodelic said in a recent post on X, adding:
"We are at a very important level here, and the weekly close will be very important."
Historical data indicates that Bitcoin typically experiences dramatic upward price movements when the MACD line (blue) moves above the signal line (orange). The most recent occurrence of this pattern was at the 2022 bear market's lowest point, which was followed by a 376% surge in BTC price.
"A big move usually follows whenever this weekly MACD bullish cross happens," analyst Mikybull Crypto said in a recent post on X.
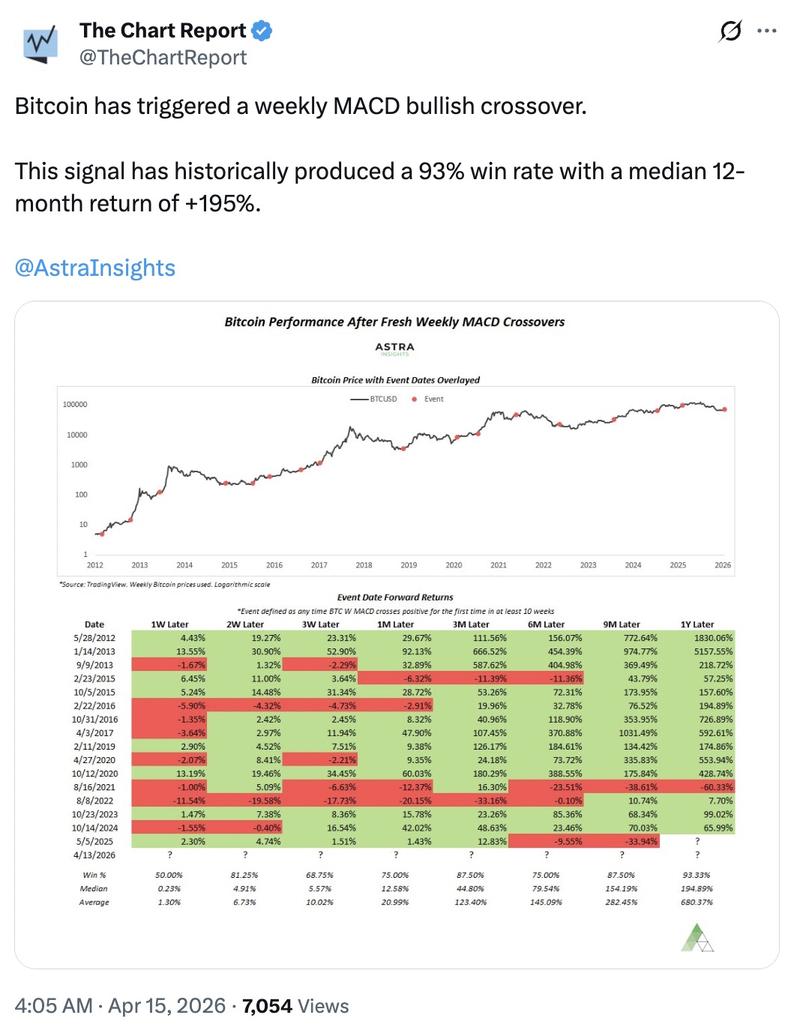
Fellow analyst The Chart Report told their followers that previous crossovers have "historically produced a 93% win rate with a median 12-month return of +195%."
Additional Bitcoin analysts propose that the altcoin may extend its upward trajectory to challenge elevated resistance zones, with BTC price objectives established at $90,000 and higher levels.