Bitcoin Drops Under $84K Triggering $550M in Cryptocurrency Liquidations
A 2.3% decline in Bitcoin's value over a two-hour period raised questions following the emergence of highly leveraged short positions on Hyperliquid.

On Wednesday, Bitcoin (BTC) slipped beneath the $84,000 threshold as a sudden downward movement triggered the liquidation of more than $500 million worth of cryptocurrency long positions.
Key points:
- Bitcoin's price temporarily fell to $83,560 while maintaining support at the 21-day moving average, currently positioned at $83,850.
- Market observers identified 40x-leveraged short positions on BTC emerging on Hyperliquid just moments before the price decline began.
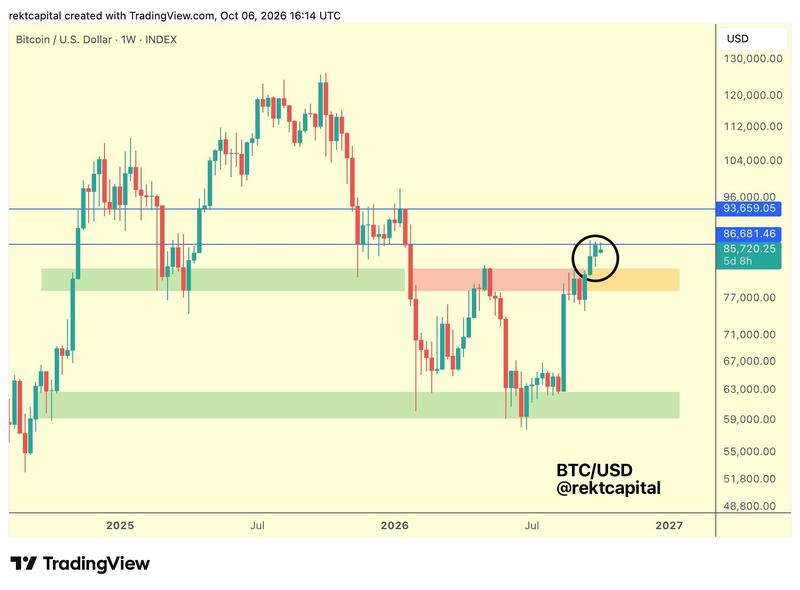
- According to Rekt Capital's analysis, a daily or three-day closing price exceeding $86,700 would be essential to validate continued upward momentum.
Hyperliquid shorts in focus after BTC price drop
Information from TradingView indicated that BTC/USD experienced a decline of up to 2.3% across two consecutive hourly candles before recovering to hover around $84,000 as of this writing.
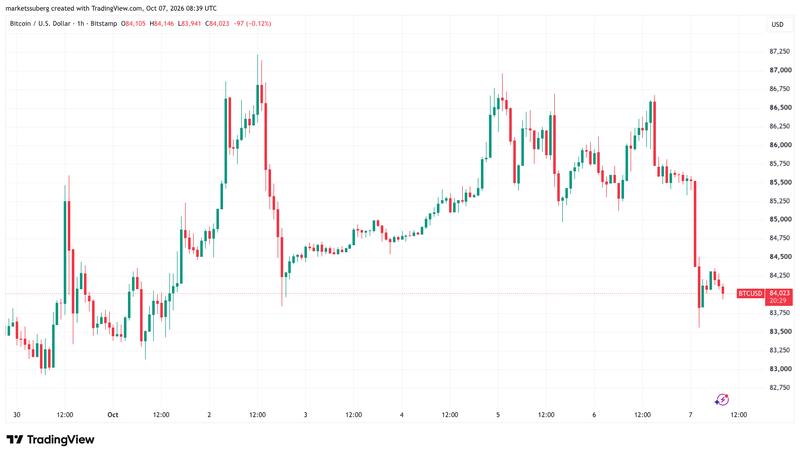
The downward movement followed a buildup of overhead ask liquidity on exchange order books, which prevented the spot price from breaking past $86,500 during Tuesday's trading session. According to data provided by CoinGlass, cumulative liquidations of crypto long positions over a 24-hour period reached $550 million.
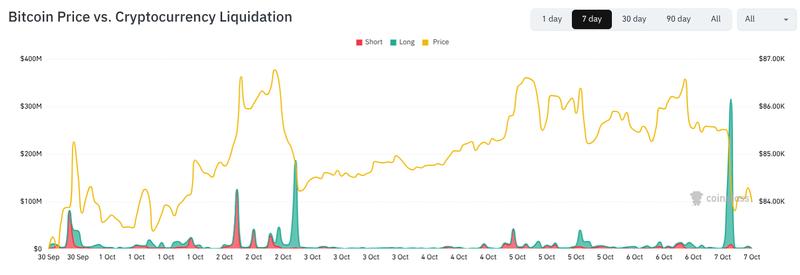
Immediately preceding the overnight price decline, onchain data from Lookonchain and additional sources shows that four separate wallets utilized the stablecoin USD Coin (USDC) to establish short positions on 148.49 BTC with 40x leverage on the Hyperliquid platform.
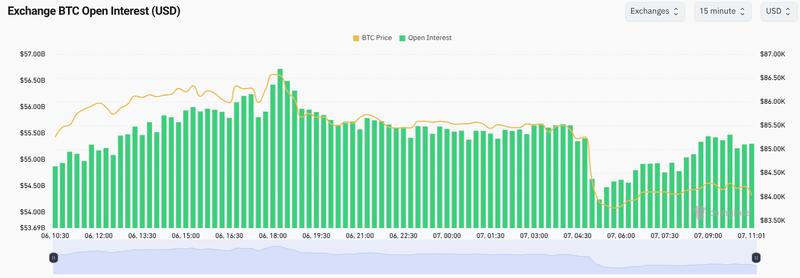
Following the flush of long positions, open interest (OI) quickly started rebounding across the 21 exchanges monitored by CoinGlass — a potential indication that market participants felt confident increasing their BTC exposure at these localized low prices. Between 4 a.m. and 10 a.m. UTC, OI climbed from approximately $54.2 billion to $55.3 billion during a six-hour window.
Bitcoin preserves nearby support levels
Even though Bitcoin was trading 1.8% lower during the day, the cryptocurrency maintained nearby support represented by its 21-day simple moving average (SMA) positioned near $83,850. Cointelegraph had previously reported that this particular level serves as a critical threshold for bullish traders on lower time frames.
Should the price fall beneath this trend line, $82,500 stands as a critical zone for Bitcoin's broader upward trend. This price point represents a significant level within an inverse head-and-shoulders reversal pattern that continues to develop on the weekly chart. The last time price touched this level was on Sept. 28.
In his most recent market analysis, trader and analyst Rekt Capital noted that Bitcoin would need a daily candle close above $86,700 to preserve a bullish configuration.
At the moment, Bitcoin is lacking that lower timeframe confirmation relative to this key level for continuation.