
Bitcoin demonstrates characteristics of bull run as technical analysis points to $90K target
On Tuesday, Bitcoin surged to the $76,000 mark following a positive technical breakout and rising network activity, suggesting a potential continuation toward $90,000.
According to market experts, Bitcoin (BTC) is displaying "renewed bullish momentum" following its Tuesday rally of more than 5% that pushed it beyond $76,000, with market participants now setting their sights on additional gains toward $90,000 as network metrics continue to improve.
Bitcoin price reaches highest level in 70 days
According to TradingView data, the BTC/USD trading pair climbed more than 5% during Tuesday's session, reaching an intraday peak of $76,120, a price point not observed since Feb. 6.
The upward movement allowed Bitcoin's valuation to recapture important support thresholds, notably the $75,000 area where both the 100-day exponential moving average and simple moving average intersect.
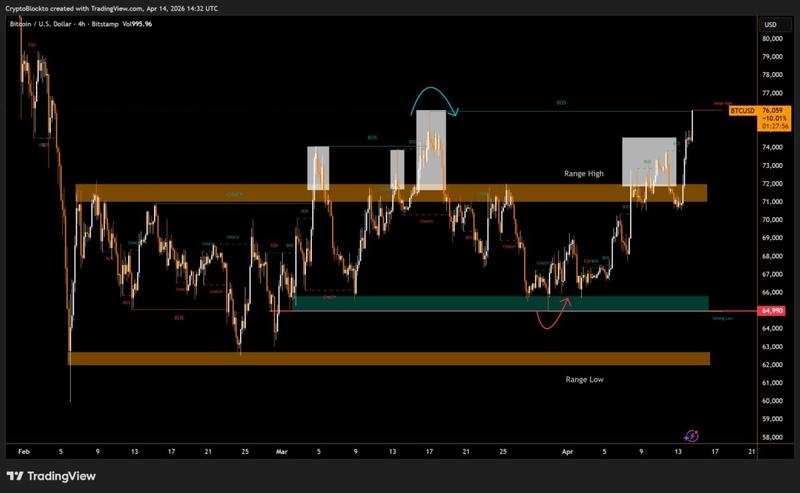
"#Bitcoin surged above the $76,000 level, breaking above its March highs and signaling renewed bullish momentum," analyst CryptoBlockto said in an X post on Tuesday.
According to the analyst, the next critical resistance area sits at $76,000, and a successful breach of this level would validate "a trend reversal and sustained upside momentum."
Looking at the technical indicators, Bitcoin appears to be confirming an ascending triangle formation following its breakout above the pattern's upper trend line at $73,000 on Monday.
Should the daily candlestick successfully close above the moving averages positioned at $75,000, this would validate the breakout, with the subsequent resistance level being the round number at $80,000.
Beyond that level, market bulls have the potential to drive BTC's price toward the ascending triangle's projected target of $89,050, representing an 18% increase from current price levels.
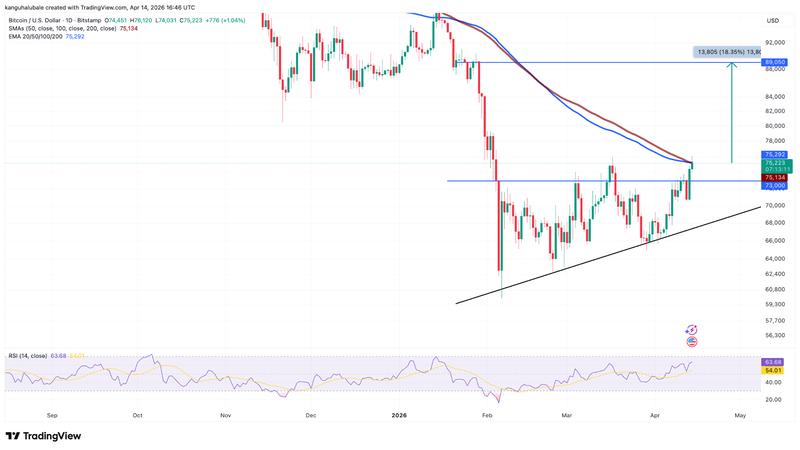
The relative strength index on the daily timeframe has climbed to 63 from the oversold reading of 15 recorded on Feb. 6, indicating strengthening bullish momentum.
"#Bitcoin is #trading within the horizontal supply zone of an ascending triangle pattern. The 100MA is also acting as a resistance barrier above the current price action," analyst CryptOpus said in a recent X post, adding:
"A strong breakout above both the #pattern and the 100MA would confirm a #bullish rally in the market."
According to Cointelegraph's previous reporting, a closing price above $76,000 would finalize a bullish ascending triangle formation, opening the door for a possible advance to $84,000.
Bitcoin's transaction activity reaches 17-month highs
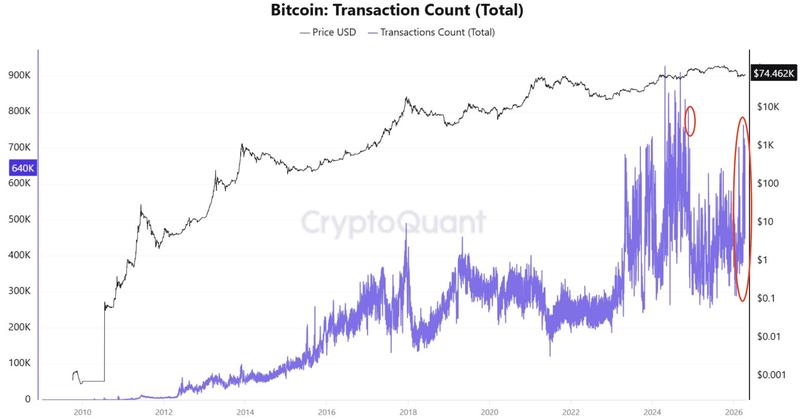
The robust performance in BTC's price is being mirrored in blockchain activity, with Bitcoin's daily count of transactions climbing 62% in 2026 to reach 765,130 million on April 5.
These levels were last observed in November 2024, a period when excitement surrounding the 2024 US Presidential Election drove Bitcoin's price beyond $100,000 for the first time ever.
"$BTC daily transaction count is higher than when $BTC was $120K," analyst CW8900 said in an X post on Tuesday, adding:
"The network is showing bull market behavior."
The total fee volume on Bitcoin's network has similarly experienced growth, rising 4% throughout the past week to $153,700, signaling "heightened onchain demand," Glassnode said in its latest Market Pulse report, adding:
"This increase implies an uptick in network activity, potentially signalling a shift in user willingness to pay for transaction priority."
The rising number of transactions and associated fees on Bitcoin's network indicates that a growing number of users are engaging with the blockchain. This points to elevated network activity, a metric that typically correlates with heightened market interest and increasing investor confidence.