
Solana's $100 Support Level May Trigger 150% Price Surge, Charts Indicate
Technical indicators and blockchain metrics suggest Solana could be positioning for a significant price recovery.
The price of Solana (SOL) appears to have established a local bottom near the $100 level across various timeframes, creating a technical configuration that may enable SOL to climb back toward $260 over an extended period.
Key takeaways:
- The bounce from weekly support around $100 for Solana indicates a possible rally toward $260.
- Blockchain metrics show growing demand with record-breaking total value locked and elevated network usage.
Multiple resistance zones stand between SOL and $260 target
The recent price movement of SOL has resulted in what appears to be a V-shaped recovery formation emerging on the four-hour timeframe.
This pattern developed after a steep decline that pushed SOL's price down 25% from its peak at $127, with buying pressure materializing near the $100 support zone.
On the four-hour chart, the relative strength index (RSI) climbed to 36 after reaching deeply oversold territory at 18, suggesting nascent bullish momentum.
On the daily timeframe, the RSI registered oversold readings at 29, a threshold that has historically coincided with price bottoms and subsequent SOL rallies.
Should bullish traders succeed in completing the V-shaped formation, several critical resistance zones must be overcome during the recovery process, starting with the $113-$115 supply region where multiple significant trendlines intersect.
The next major hurdle lies within the $125-$130 supply area, characterized by the 50-day EMA and 50-day SMA, respectively.
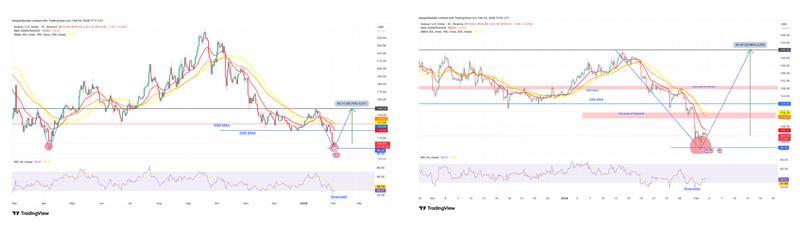
Beyond these levels, the SOL/USD trading pair may continue ascending toward the pattern's neckline positioned near the $150 supply area, which would constitute a 44% gain from current price levels.
Taking a broader view, analysis of the weekly timeframe shows robust support for SOL within the $95-$100 range, as illustrated in the chart below.
The previous bounce from this support level sparked a 166% rally in SOL's price to $250 from $95 spanning the period between April 2025 and September 2025.
Should history repeat itself, SOL may prolong the current recovery throughout the upcoming weeks or months to reach $260, which would mark a 150% appreciation from present price levels.
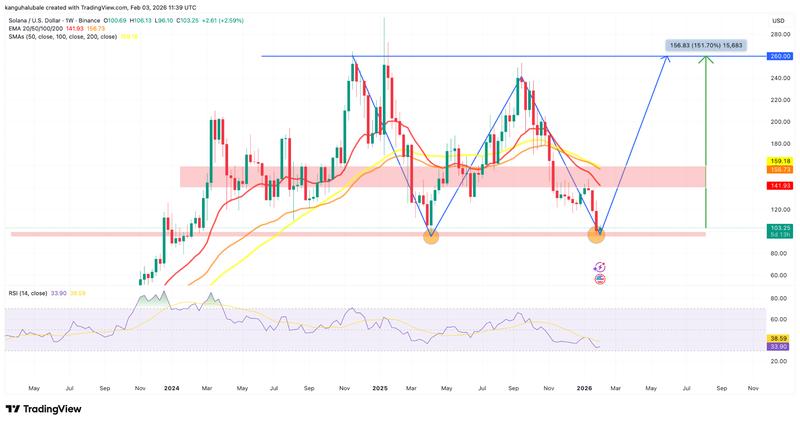
The 50-week MAs are positioned within the $140-$160 range, an area that has traditionally acted as resistance and slowed previous price advances.
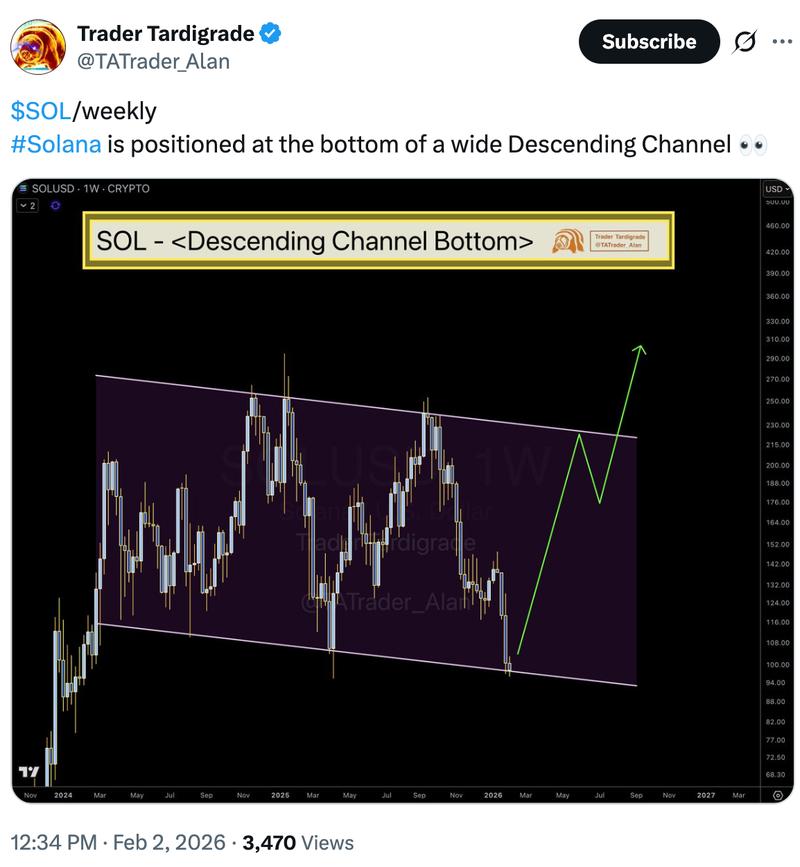
According to Trader Tardigrade, SOL's recovery from the descending channel's lower boundary may drive prices toward the upper boundary located around $215.
According to previous Cointelegraph coverage, SOL's price could advance toward the $120-$150 range provided the 20-day EMA at $106 can be recaptured and maintained as support.
TVL and network activity indicators show strength for Solana
Key decentralized application (DApp) metrics for Solana began demonstrating robustness during the middle of January.
The total value locked (TVL) on the network, which quantifies the capital deposited within its smart contracts, climbed to an all-time high of 73.4 million SOL on Monday, equivalent to approximately $7.5 billion based on current market prices. This marks an 18% growth over the preceding seven days.
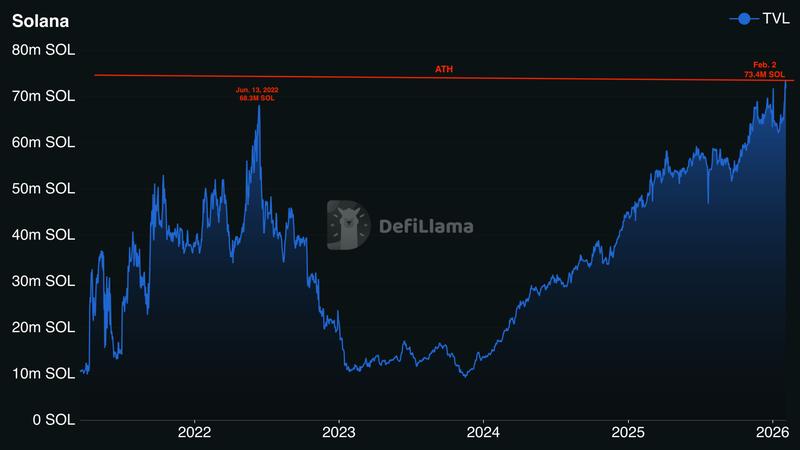
The previous occasion this indicator reached daily peak territory occurred in June 2022, when TVL achieved $68.3 million SOL. That increase was predominantly driven by elevated network activity and the NFT market expansion on Solana throughout 2021. The period saw SOL's price appreciate by 80% during the timeframe from June through August 2022.
Furthermore, Solana's daily transaction volume reached a two-year peak of 109.5 million on Monday.
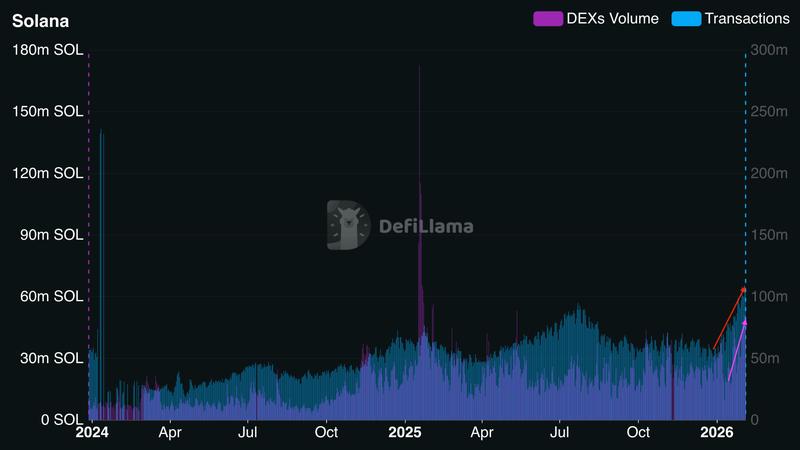
Daily decentralized exchange (DEX) volume similarly touched an eight-month peak of $51.3 million SOL on Monday, whereas the weekly DEX trading activity achieved a 12-month high of 264.8 million SOL for the week concluding on Sunday.
As previously documented by Cointelegraph, the count of daily active addresses on Solana experienced a 115% surge during January's second half, an indicator that has traditionally correlated with positive price action for SOL moving forward.
This article does not contain investment advice or recommendations. Every investment and trading move involves risk, and readers should conduct their own research when making a decision.