
Technical Analysis Points to Potential $100K Bitcoin Rally by Fall 2026
Technical indicators including a double-bottom formation, bullish weekly RSI divergence, and whale activity patterns suggest BTC could break out as it approaches critical resistance levels.

Technical analysis of Bitcoin (BTC) charts indicates that a potential rally toward $100,000 could materialize as early as September, according to current market patterns.
Key takeaways:
- Bitcoin is painting a potential double-bottom and bullish divergence pattern.
- BTC price must break above a resistance confluence near $66,700
Double-bottom formation signals potential 60% price surge for BTC
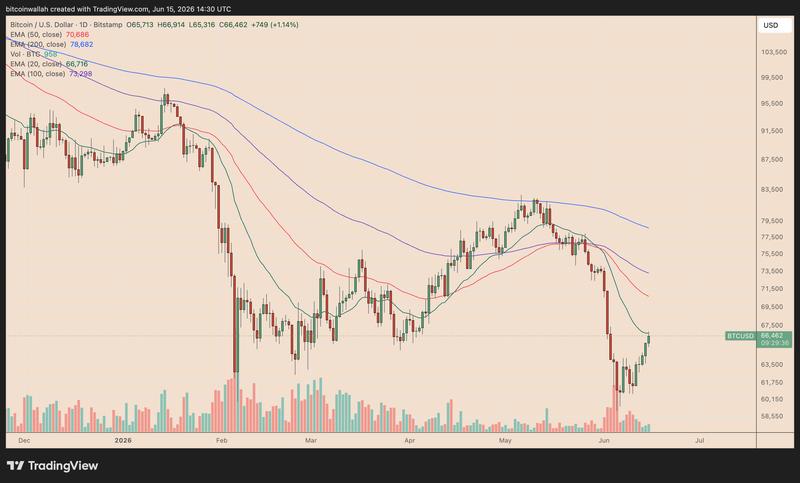
Bitcoin's price surged 13.25% higher from its recent bottom below the $60,000 level, benefiting from renewed risk appetite in global markets following a tentative truce agreement between the US and Iran.
This rebound lifted BTC toward the $67,000 mark on June 15, mirroring a wider relief rally across risk-on assets as the geopolitical de-escalation drove oil prices down and eased immediate inflation concerns.
Currently, Bitcoin's three-day timeframe chart displays signs of a possible double-bottom reversal formation around the $60,000 support level.
The cryptocurrency has now bounced from the $60,000 zone twice during 2026, reinforcing the thesis that accumulation is occurring at this same demand area that had previously provided support throughout past pullbacks.
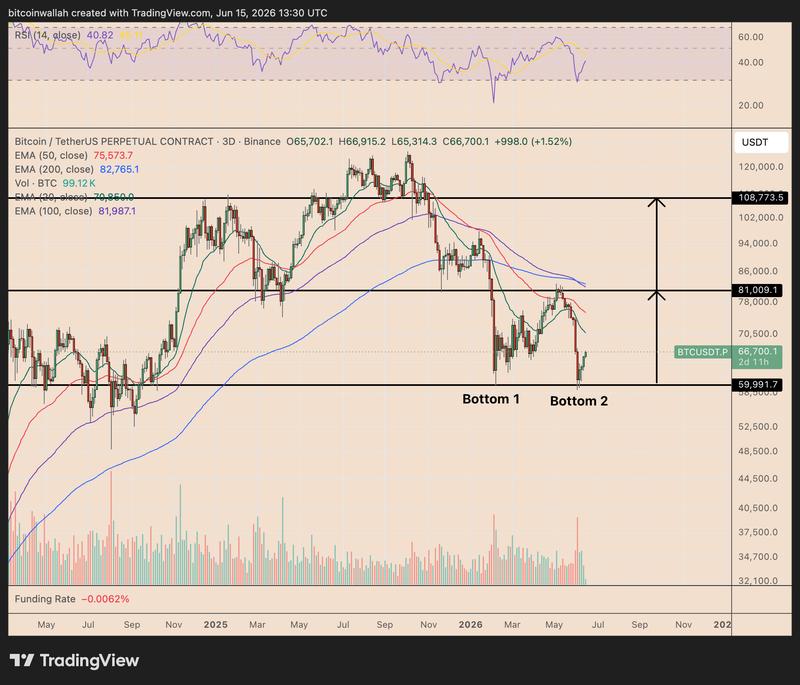
The initial bottom materialized around March's low point, whereas the most recent bounce occurred following a steep June selloff that temporarily drove Bitcoin down to approximately the same price level. Provided BTC maintains support above $60,000, this double-bottom formation continues to hold validity.
This pattern's neckline resistance is positioned around $81,000, a level where Bitcoin had previously encountered resistance before the most recent downward move.
A confirmed breakout above this threshold would validate the double-bottom chart pattern and create a pathway for a measured price target of approximately $108,000 by August or September, representing potential upside exceeding 60% from present levels.
Bullish weekly RSI divergence reinforces path to $100,000
The weekly timeframe for Bitcoin is displaying a bullish divergence signal between actual price movement and the relative strength index (RSI) momentum oscillator.
While BTC recently registered a lower low around the $60,000–$65,000 support area, the weekly RSI simultaneously printed a higher low. This pattern indicates that despite sellers driving price lower, they did so with diminishing strength.
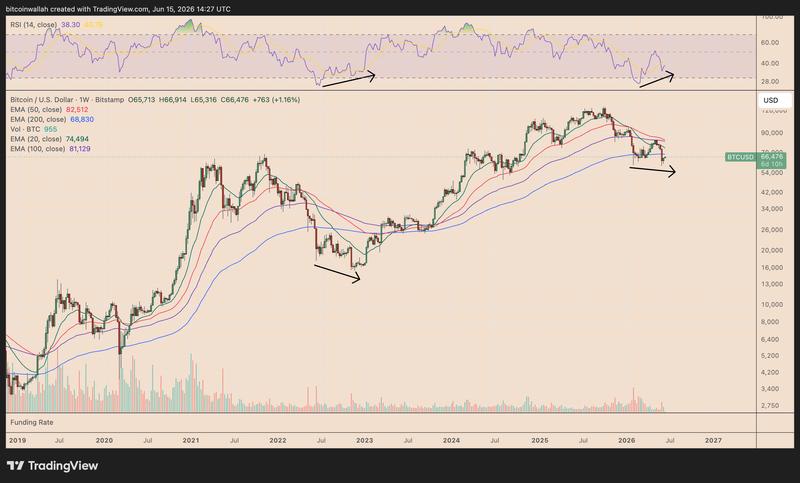
A comparable divergence pattern emerged near Bitcoin's 2022 bear-market low, when the RSI began recovering ahead of price action, which subsequently followed with an extended multi-month rally.
According to a Monday analysis, analyst Jelle suggested Bitcoin could behave "similarly to late 2022 in the coming months."
This present technical configuration adds weight to Bitcoin's double-bottom scenario developing near $60,000. Confirmation still requires BTC to overcome initial major resistance zones, with the 20-week EMA positioned at $74,500 and the 50-week EMA located around $82,500.
Successfully recapturing these exponential moving average levels would enhance the likelihood of a summer rally pushing toward $100,000. Conversely, a weekly candlestick close beneath $60,000 would undermine the constructive technical outlook.
Bear flag pattern poses downside risk
Bitcoin's near-term chart structure still suggests the possibility of another leg down before any broader bullish reversal pattern achieves confirmation.
BTC is currently challenging a resistance confluence created by the bear flag's ascending trend line and the 20-day EMA (green) situated near $66,700.
Failure to break through this area could drive price action back down toward the flag's descending trend line located near $63,600, maintaining Bitcoin within its bearish continuation formation.
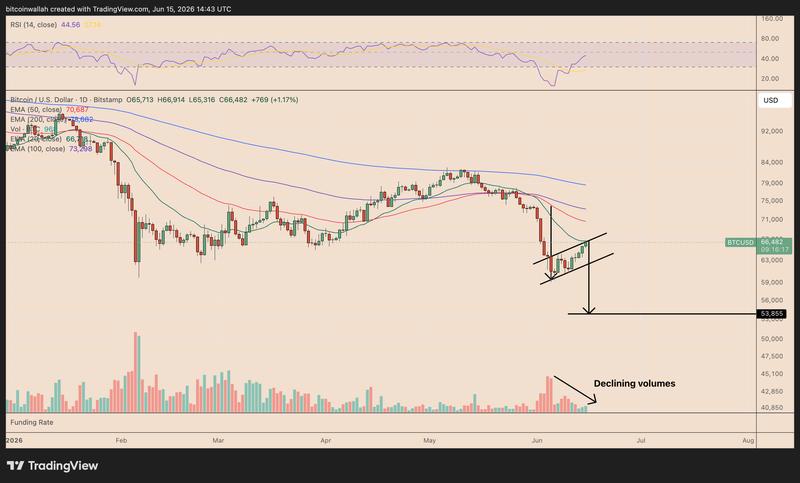
A confirmed daily candle close beneath that lower trend line would trigger the bear flag breakdown pattern. Using the measured move technique based on the preceding selloff's magnitude, the projected downside objective sits at $53,850, representing approximately 20% decline from current price levels.
Decreasing volume throughout the flag's construction heightens the probability of this bearish scenario materializing, since weak market participation typically suggests the bounce is corrective in nature rather than representing impulsive buying pressure.
Whale deposit activity to exchanges suggests distribution pressure
The bearish near-term technical picture also corresponds with increased distribution activity from Bitcoin whales.
CryptoQuant analyst Darkfrost observed that whale deposit flows to Binance increased significantly following BTC's recent price correction. Major holders transferred an average of 3,200 BTC daily to the exchange throughout the past month, climbing from 1,200 BTC at the conclusion of April.
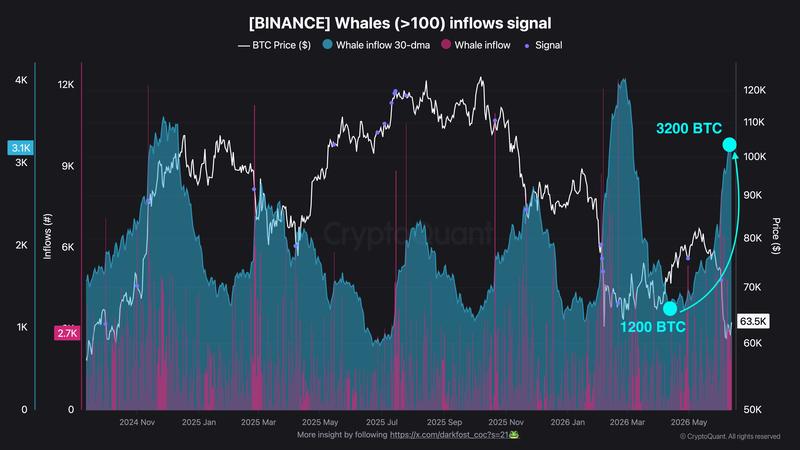
"This trend suggests that many large holders increased their selling activity, or at least their willingness to sell, during the recent downturn," he wrote in a Monday note.