
BTC Faces $70K Drop Risk After Strategy's STRC Falls Under Par Value
Strategy's preferred stock STRC has fallen beneath its $100 par value, suggesting the company may temporarily halt its Bitcoin acquisition activity this week, potentially enabling bearish forces to drive prices toward $70,000.

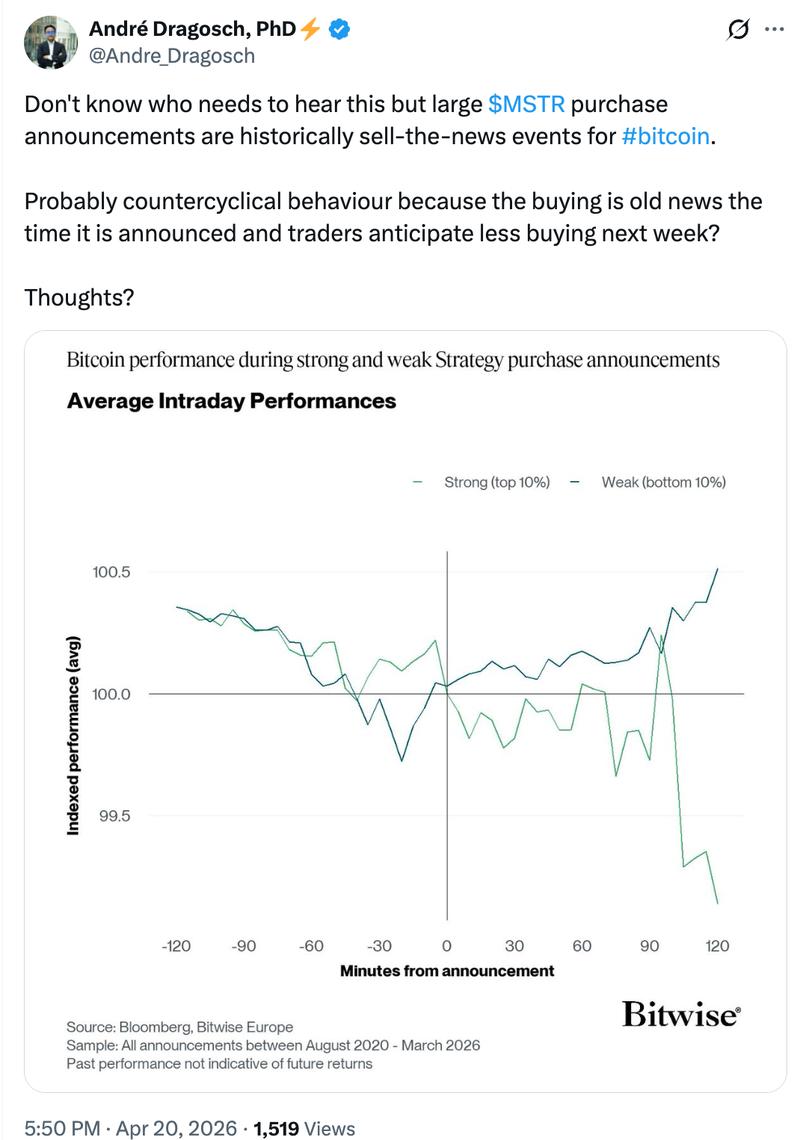
On Monday, Bitcoin (BTC) experienced a 2.66% increase, climbing to approximately $75,800 following Strategy's announcement of a $2.54 billion acquisition, marking the firm's third-largest purchase on record and representing roughly 2.5 months' worth of newly mined BTC supply.
Nevertheless, multiple market signals point to the possibility that this upward momentum could soon lose steam.
Important highlights:
- Unfavorable macroeconomic conditions could trigger a BTC price correction should Strategy reduce its purchasing activity.
- Technical indicators for Bitcoin suggest a possible decline to the $67,000–$69,000 range.
Strategy's BTC buying spree may come to a temporary stop
The majority of Strategy's most recent acquisition of 34,164 BTC was financed through its preferred stock offering, Stretch (STRC), which raised more than $2.17 billion via at-the-market share sales conducted between April 13 and April 19.
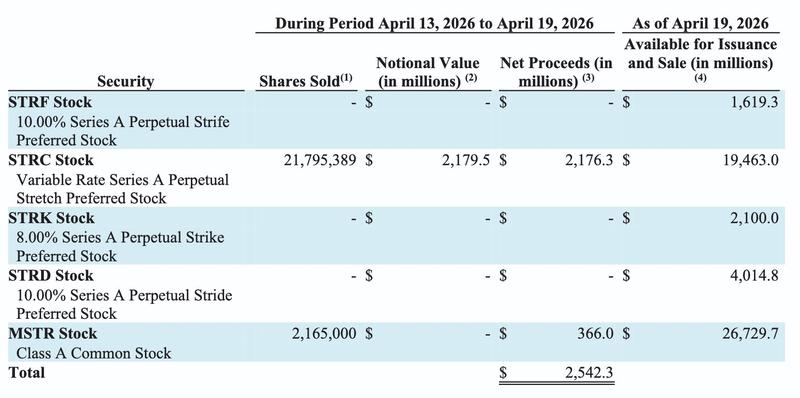
This figure represented approximately 86% of the complete sum allocated for the purchase, with additional capital of $366 million coming from sales of the company's Class A common stock, MSTR.
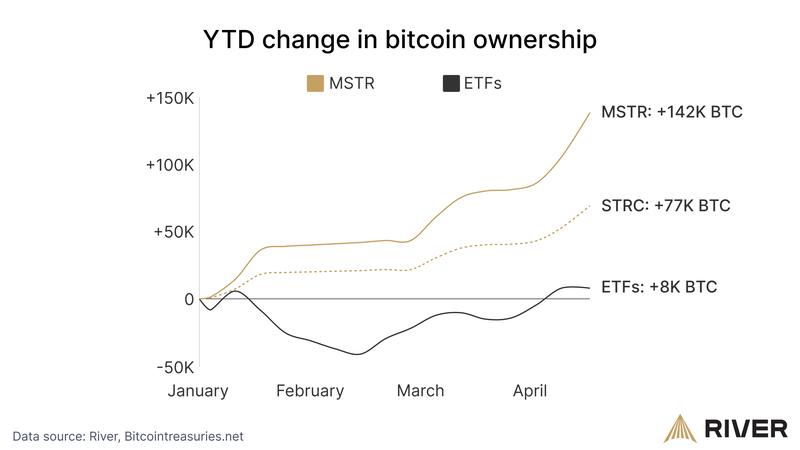
The STRC instrument allows Strategy to generate capital for Bitcoin acquisitions when its trading price reaches or exceeds $100. Higher stock valuations translate to more efficient capital raising and increased BTC purchasing capacity. Throughout 2026, STRC has facilitated the acquisition of 77,000 BTC, a volume ten times greater than the combined purchases of all exchange-traded funds, according to River data.
However, STRC's price has remained below its $100 par value since April 15, a development that could restrict Strategy's capability to continue generating cash for additional Bitcoin purchases during the current week.
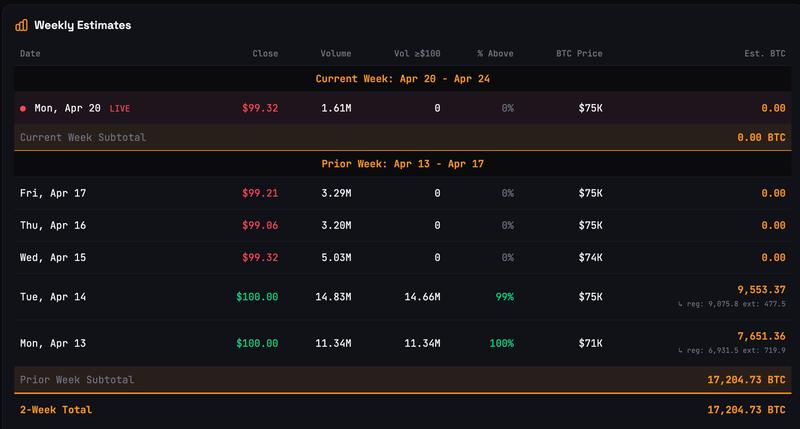
Historical patterns show that interruptions in Strategy's Bitcoin buying activity have frequently aligned with downward pressure on BTC prices.
Specifically, on average, Bitcoin's valuation has declined by approximately 30% during periods when STRC has traded beneath its $100 par value threshold.
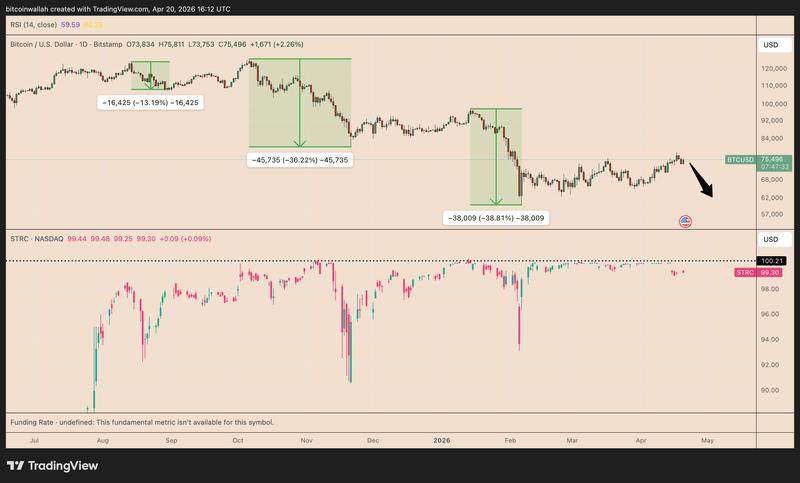
Should a 30% correction materialize from present price levels, Bitcoin would decline to approximately $53,000.
This potential pause in buying activity emerges as risk appetite deteriorates, evidenced by declining US equity indexes amid growing uncertainty surrounding the US–Iran peace agreement.
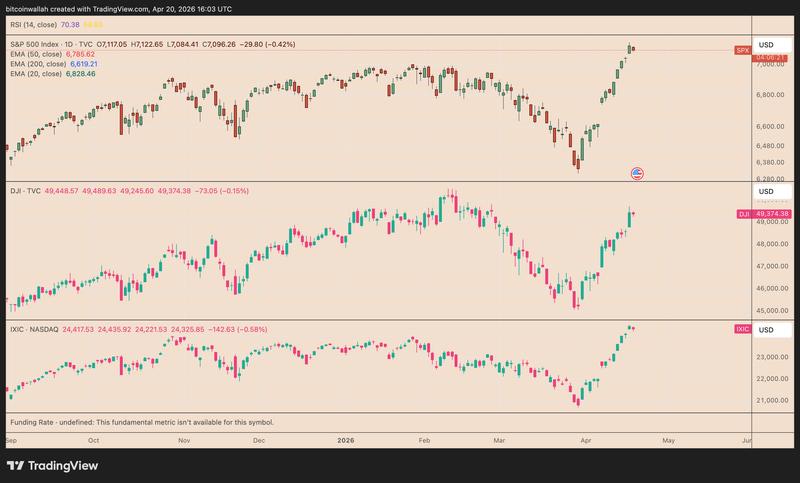
President Donald Trump of the United States indicated that extending the two-week ceasefire beyond its Wednesday expiration date would be "highly unlikely" in the absence of a formal agreement.
Should the Middle East conflict show indications of prolongation, Bitcoin's price could face additional downward pressure.
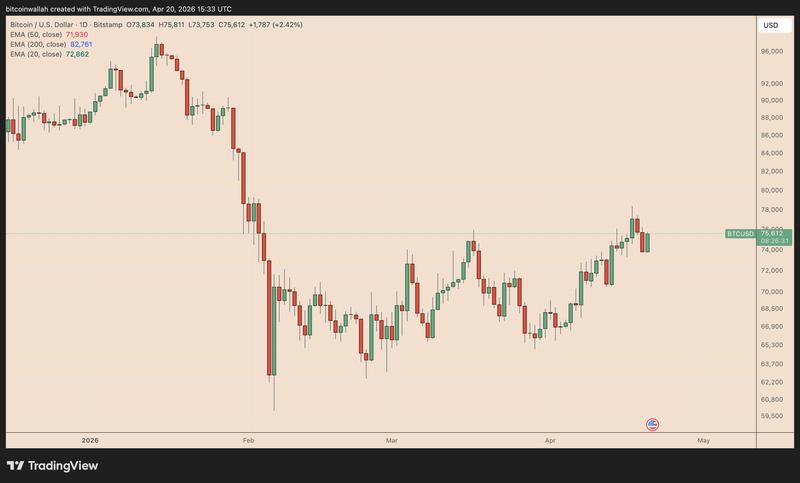
Technical flag pattern suggests potential drop to $67,000–$69,000 zone
The current technical formation on Bitcoin's chart displays a textbook flag consolidation pattern, with price action now moving toward the lower edge of this structure. This configuration increases the probability of a price retreat to the $67,000–$69,000 area during April, should the support level fail to hold.
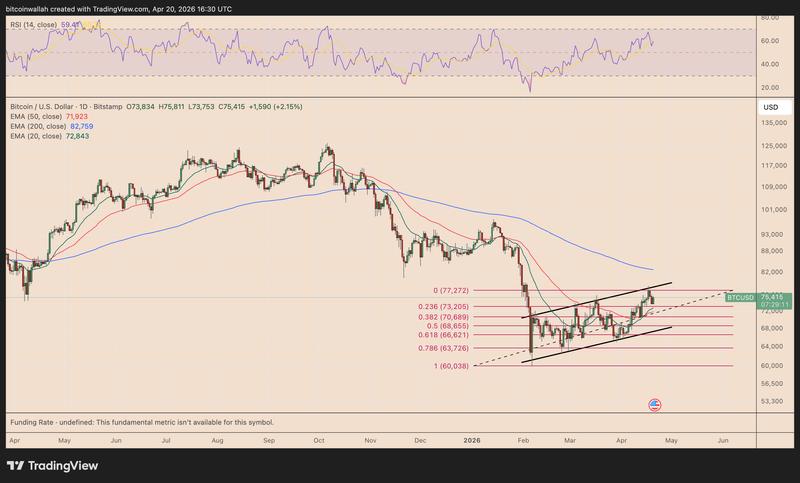
Simultaneously, the potential for downside movement may be constrained as both the 20-day (green) and 50-day (red) exponential moving averages persist in functioning as dynamic support zones. Maintaining price action above these moving averages would indicate continued buying interest, thereby improving prospects for a price bounce.
Should such a scenario unfold, Bitcoin could make an attempt to break above the flag pattern's upper boundary line, thereby negating the bearish technical formation.
A successful upward break would create an opportunity for price recovery targeting the 200-day EMA (blue), which is presently positioned around $82,750.
According to previous Cointelegraph coverage, surpassing the resistance zone near $78,000 has become a critical objective for bullish market participants.
This article is produced in accordance with Cointelegraph's Editorial Policy and is intended for informational purposes only. It does not constitute investment advice or recommendations. All investments and trades carry risk; readers are encouraged to conduct independent research before making any decisions. Cointelegraph makes no guarantees regarding the accuracy or completeness of the information presented, including forward-looking statements, and will not be liable for any loss or damage arising from reliance on this content.