
XRP Tumbles Almost 30% Year-to-Date With Technical Indicators Signaling Potential Drop to $1
Technical analysis of XRP reveals bearish momentum persisting, with multiple indicators suggesting the cryptocurrency could retest the $1 support threshold in upcoming weeks.

On Thursday, XRP (XRP) was changing hands 64% beneath its multi-year high of $3.66, while additional indicators emerged suggesting a possible extended pullback toward the $1 mark.
Key takeaways:
- XRP encounters significant resistance beyond $1.40, a price level where investors previously purchased over 1.1 billion tokens.
- Decreasing daily active addresses indicate diminished transaction activity and weakening network demand for XRP.
- Subdued spot ETF inflows suggest waning institutional demand.
Symmetrical triangle pattern points to $1 XRP price target
According to TradingView data, XRP is currently trading beneath a critical resistance area on the daily timeframe, as illustrated in the chart below.
This resistance zone spans $1.40-$1.45, representing a supply area where the symmetrical triangle's upper trend line, the 200-week exponential moving average (EMA), and the 50-day EMA all intersect.
The cost-basis distribution heatmap indicates that market participants accumulated more than 1.1 billion XRP tokens within this particular price range.
Should XRP attempt to breach this resistance level, it could encounter significant selling pressure from these holders, many of whom may be looking to exit at breakeven prices.
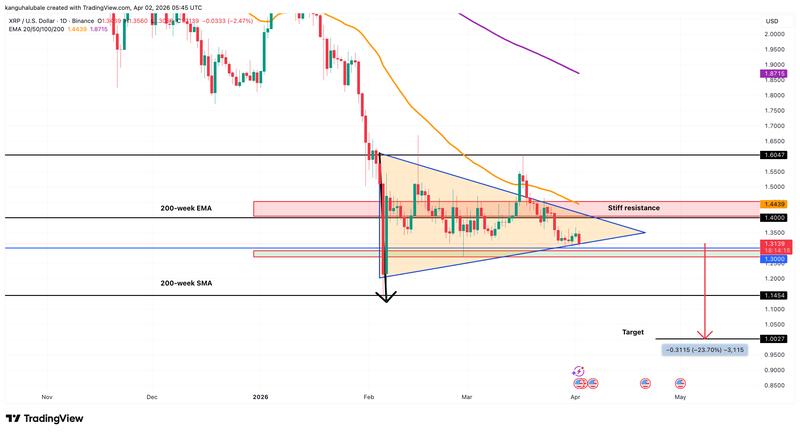
Currently, the price is testing the symmetrical triangle's lower boundary positioned at $1.30.
Should the price break beneath this support level, it would validate the downtrend's continuation, initially targeting the 200-week SMA positioned around $1.14, before potentially reaching the triangle's measured objective at $1.
"If XRP loses its current support, data highlights downside targets near $1.146 and $0.884," CryptoBasic analysts stated in a Wednesday post on X, further noting:
"The broader bullish structure remains valid only if XRP holds above the critical $0.93 level, which acts as the main invalidation point."
According to Cointelegraph's previous reporting, maintaining the $1.27 support level is essential for bulls in the near term to prevent additional downside movement.
XRP network activity experiences decline
Meanwhile, onchain metrics demonstrate that the XRP Ledger has witnessed a substantial decline in network activity starting from July 2025.
Glassnode data indicates that the network's daily active addresses (DAAs) currently sit well below the levels observed during March and June 2025, remaining subdued around the 50,000 mark.
At the time of writing, with approximately 48,000 daily active addresses, user transaction volume has contracted, potentially indicating diminished interest or weakening confidence in XRP's short-term prospects.
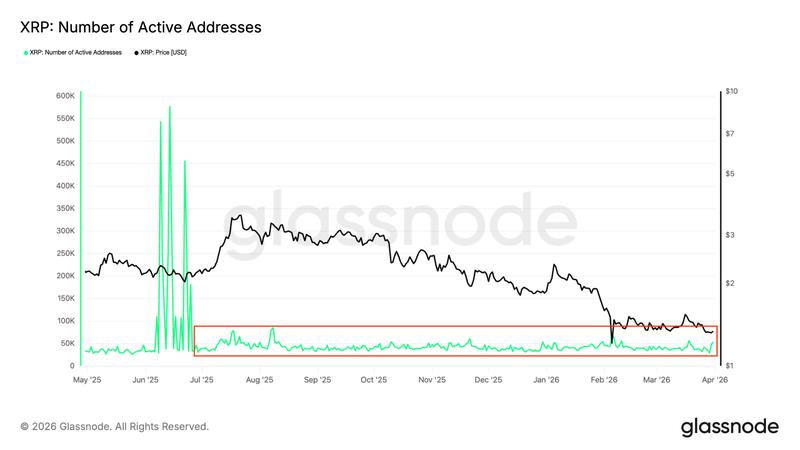
Historically, when network activity experiences downturns, it typically correlates with price consolidation, as reduced transaction volume translates to diminished liquidity and fewer market participants on the buy side.
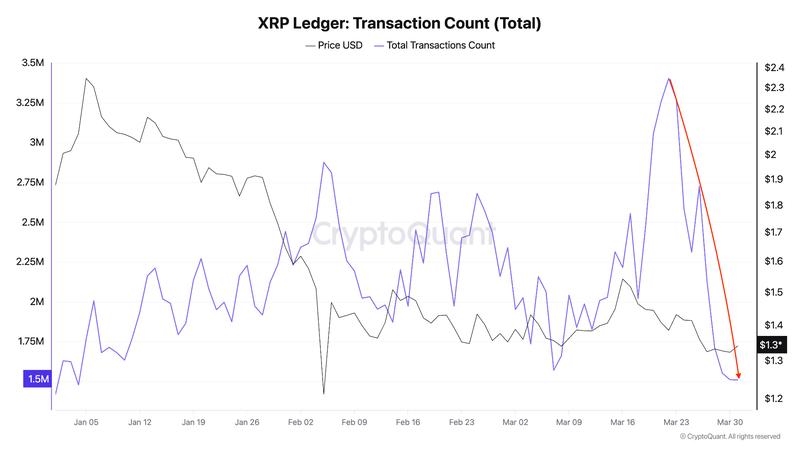
Transaction count on a daily basis has similarly plummeted by 44% to 1.5 million on Wednesday, down from 3.4 million recorded on March 21, according to CryptoQuant data.
Furthermore, flow data from US-based spot XRP exchange-traded funds (ETFs) signals declining institutional appetite, with March representing the first month of negative flows since these products launched.
Spot XRP ETFs are experiencing challenges, registering zero inflows starting from March 26 as the "price declines and demand weakens," noted Analyst WizzyOnChain in a recent X post, who also commented:
"In March, they have accumulated net outflows of $28 million, marking their first negative month since their launch."
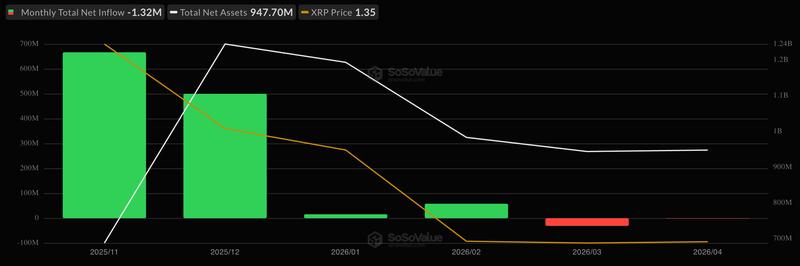
Assets under management reached their zenith at approximately $1.24 billion during early January but have subsequently declined to around $947 million as of today, pulled downward by XRP's price depreciation exceeding 28% throughout the first quarter of 2026.