SOL Futures Interest Plummets 30% Amid Altcoin Selloff: Could $68 Be the Next Stop?
Bullish sentiment evaporates as Solana futures open interest plunges 30% throughout May. Trading near $80, SOL faces potential decline to fresh yearly lows.
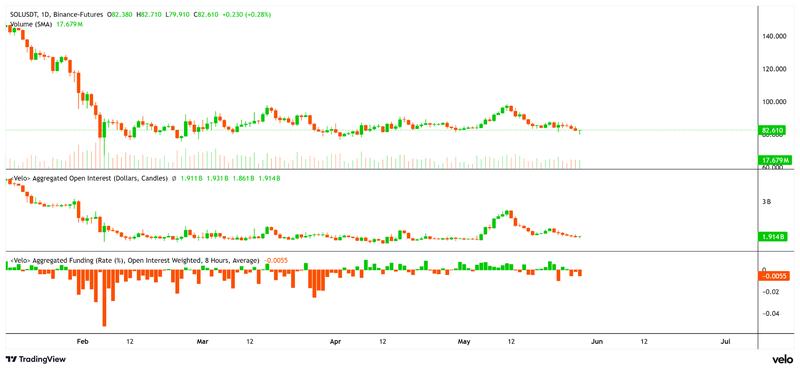
Throughout May, Solana (SOL) futures contracts experienced a significant downturn as market participants scaled back their leveraged positions across every major exchange. The open interest (OI) for SOL declined from $2.75 billion on May 11 to $1.90 billion by Thursday, representing a substantial 30% reduction, even as funding rates stayed relatively neutral. This convergence of factors suggests deteriorating market confidence while SOL approaches a potential retest of the $68 yearly low.
Spot market demand counterbalances derivatives weakness for SOL
Funding rates for Solana futures on an aggregated basis remained around -0.005, indicating equilibrium in positioning between traders holding long and short positions. Despite the recent price deterioration toward $80, SOL market participants have refrained from establishing heavily directional wagers.
Simultaneously, the aggregated cumulative volume delta (CVD) for futures with stablecoin margins dropped to an annual low of -$13 billion. This CVD metric monitors whether purchasing or selling activity dominates across time periods. The downward trend indicates heightened sell-side momentum within futures markets throughout the month of May.
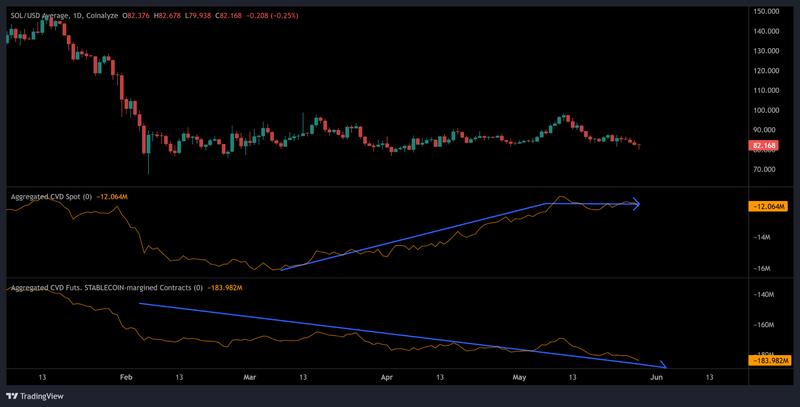
In contrast, the picture emerging from spot trading activity appears more stable. Since March, spot CVD has climbed to $350 million, demonstrating that purchasing activity has persisted on spot platforms even while derivatives market positioning has deteriorated.
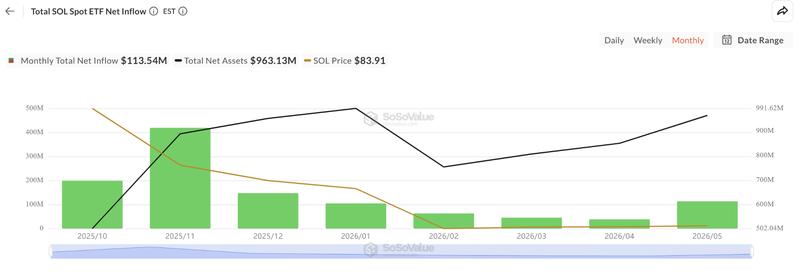
This trend received additional support from positive capital flows into spot SOL exchange-traded funds (ETFs). Net inflows for May totaled $113 million, representing the most robust monthly performance for SOL ETFs throughout 2026.
When futures selling diverges from consistent spot accumulation, it typically suggests diminished speculative interest rather than widespread fear-driven liquidation. This pattern reveals that traders employing leverage have withdrawn from riskier positions, even as spot market participants have methodically continued building their holdings.
SOL challenges the $80 support level within three-month consolidation pattern
Analyzing the technical picture, SOL remains confined within an extended consolidation zone spanning $80 to $95. This trading range developed following a sharp 42% decline for Solana throughout Q1. Wednesday saw the price retreat to the lower threshold following yet another failed attempt to breach resistance.
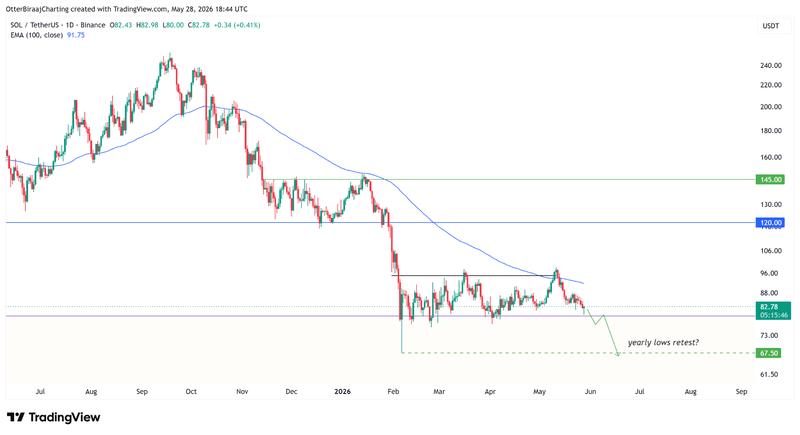
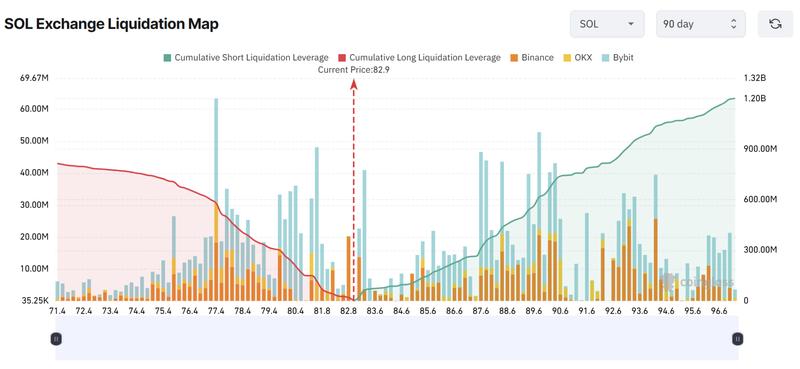
Should price action break beneath $80, attention shifts toward the annual bottom positioned around $68. According to liquidation heat maps, over $800 million in accumulated long leverage positions are concentrated in that vicinity, establishing it as a critical liquidity zone should bearish momentum intensify.
Market analyst Cold Blooded Shiller characterized SOL as among the most vulnerable large-cap cryptocurrency charts currently. Through a post on X, the analyst noted that SOL has maintained a downward trajectory since October and demonstrates limited robust support beneath the present $80 price threshold.
Cryptocurrency commentator Zoe has similarly positioned bid orders around $67, closely matching both the yearly minimum and the densest concentration of leveraged liquidation positions visible on the open leveraged positions heatmap.