SOL ETF Capital Surge Signals Market Revival as Analysts Target $120 Price Level
Investment flows into Solana ETFs reached their highest weekly level in months while futures open interest jumped nearly 30%. Market watchers anticipate SOL could climb to $120.

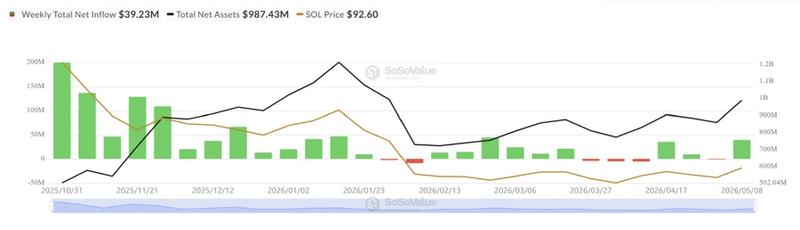
Exchange-traded funds tracking spot Solana (SOL) experienced their most robust weekly showing since February, pulling in $39.23 million in aggregate net capital flows. This influx of investment capital occurred in tandem with Solana futures open interest expanding by $1.5 billion throughout May, reflecting a pronounced uptick in derivative market trader positioning.
The heightened market engagement emerged alongside a 15% price appreciation that pushed Solana to $97 over the preceding seven-day period, with market participants now setting their sights on the subsequent critical resistance threshold positioned at $120.
Futures activity climbs in parallel with SOL ETF capital flows
The BSOL ETF from Bitwise spearheaded the recent influx surge, capturing $36 million in net weekly inflows during the most recent period, while Fidelity's FSOL contributed more than $1.8 million. From its inception, BSOL has accumulated $861 million in total inflows, representing approximately 81% of all cumulative capital across spot SOL ETF products, which collectively stand at roughly $1.06 billion.
Derivative market participation expanded in conjunction with the exchange-traded fund demand. Open interest (OI) for Solana surged to $6.4 billion from the May 1 level of $4.94 billion, representing a 29.5% gain in under a two-week timeframe.
The aggregated spot cumulative volume delta (CVD), a metric that tracks the net differential between market purchasing and selling orders, advanced to approximately $250 million from $163 million across a five-day span, coinciding with SOL's advance toward the $96 price point.
Futures CVD grew to roughly $593.6 million following consistent increases beginning May 5, as purchasing interest consumed available sell-side liquidity across both spot and derivative trading venues.
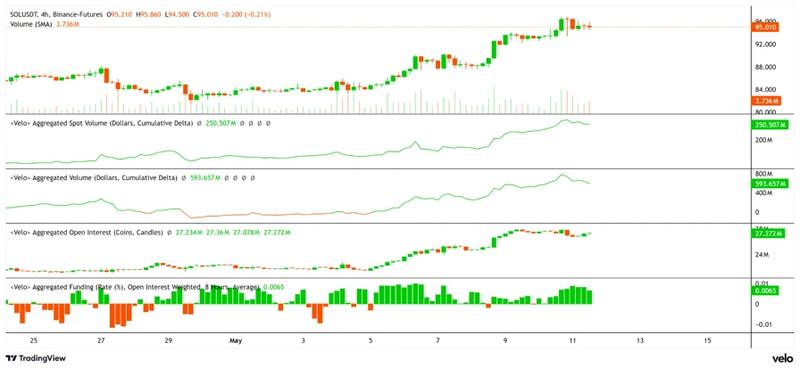
Funding rates remained positioned around 0.065%, demonstrating that market participants were willing to pay premiums to sustain long position exposure. Purchase activity has begun leveling off in the vicinity of the $95-$96 price range as both spot and volume deltas have experienced cooling trends during the most recent 24-hour trading period.
Technical formation points to potential Solana breakout: Could $120 be the next target?
A technical Adam and Eve chart pattern is developing for Solana in proximity to the $95 resistance zone, with the formation's neckline positioned precisely at the present breakout area. A validated advance beyond this threshold establishes the technical price objective in the vicinity of $120.
The presence of an Adam and Eve configuration on the extended time frame chart analysis may indicate a price floor has been established for SOL should the asset successfully convert the $95 resistance threshold into a supportive price level.
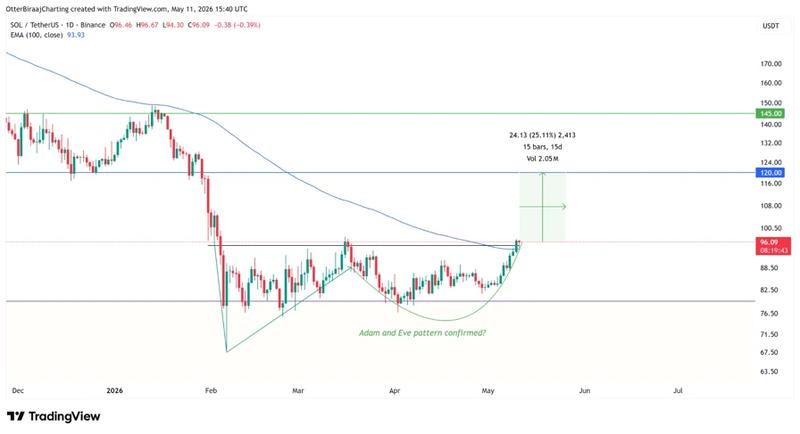
Additionally, SOL penetrated above its 100-day exponential moving average for the initial occurrence since October 2025, introducing another technical transformation to the landscape alongside exchange-traded fund capital influx and ascending futures market positioning.
A validated daily candle closure combined with price consolidation above the $95 level may unlock a trajectory toward the pattern's forecasted objective near $120, attributed to minimal resistance existing between these two price points following the 42% decline experienced during February.
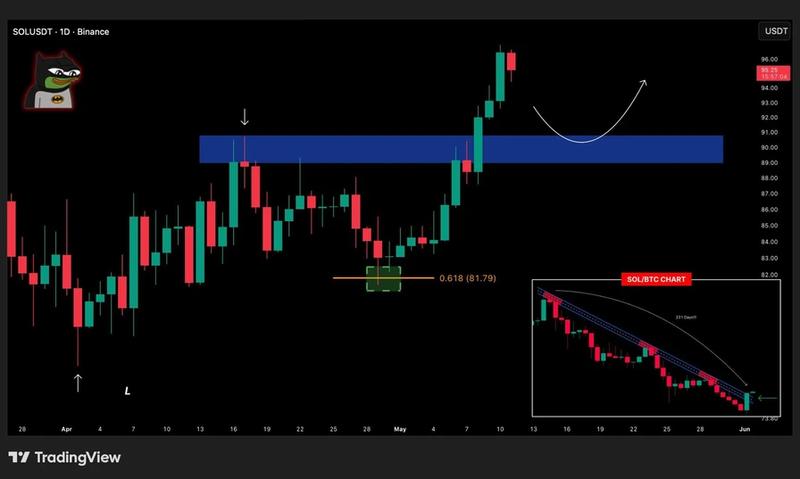
Cryptocurrency market analyst BATMAN observed that Solana recently penetrated above a 231-day descending trend line on the SOL/BTC daily timeframe chart, indicating strengthening relative performance compared to Bitcoin. Based on the analyst's assessment, the $89-$91 price zone currently functions as the closest support cluster and represents a probable retest area should SOL maintain prices above the breakout territory.