Crypto analyst predicts fresh downside as dollar index targets multi-month highs
BTC prices declined following US-Iran tensions, with market observers cautioning that a strengthening dollar index could trigger additional losses throughout cryptocurrency markets and risk-sensitive assets.

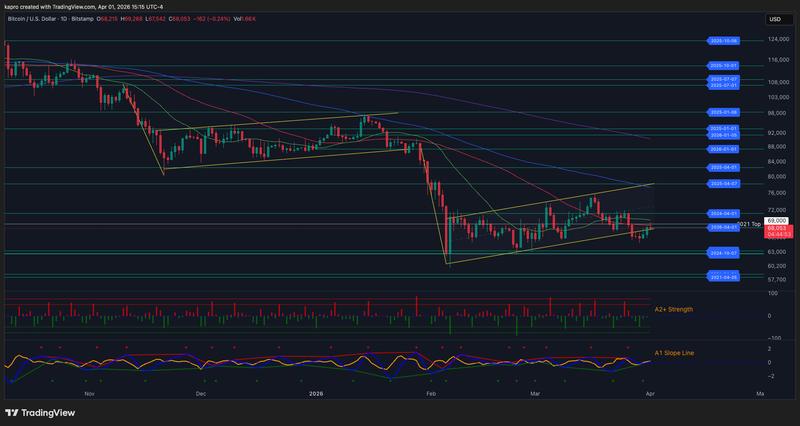
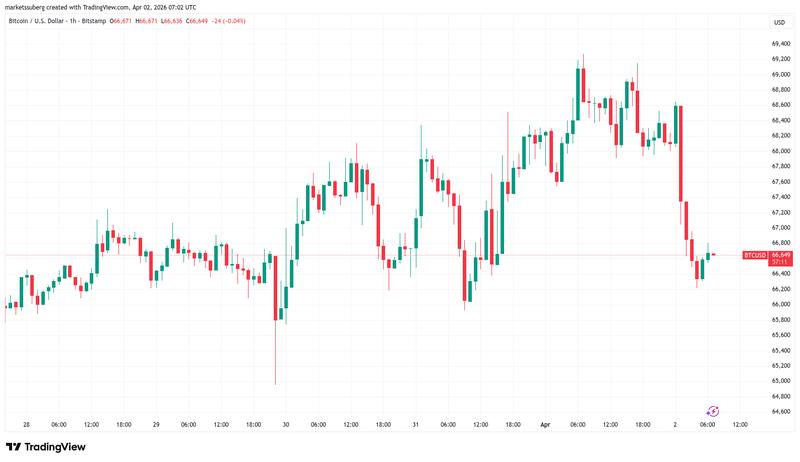
Bitcoin (BTC) encountered yet another resistance barrier at the $69,000 level during Thursday's trading session as markets for risk-oriented assets experienced turbulence following developments in the US-Iran conflict narrative.
Key points:
- Bitcoin encounters renewed selling pressure alongside declining equity markets and precious metals following US President Donald Trump's national address.
- The US dollar index gains momentum amid expectations of a breakthrough to its highest levels in approximately one year.
- A resurgent dollar would push Bitcoin toward "new lows," according to trader analysis.
Trump speech triggers simultaneous declines in Bitcoin, equities and precious metals
According to TradingView data, BTC experienced a 2% decline over the 24-hour period with price action bottoming near the $66,200 mark.
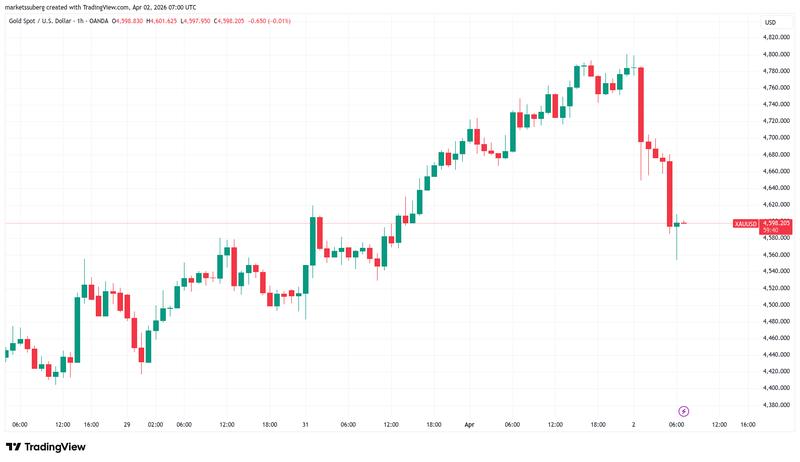
The cryptocurrency market mirrored the movements of traditional equities and gold, all declining in response to US President Donald Trump's national address. Despite market participants hoping for signs of conflict de-escalation, Trump's messaging maintained the possibility of continued hostilities with Iran.
"Between threatening Iran's power plants, saying the Iran War would last 2-3 more weeks, and calling out NATO, there was nothing new," trading resource The Kobeissi Letter wrote in a reaction on X.
"Yet, the market is now trading like the Iran War is ramping up for another month-long escalation. Why? Because he didn't explicitly de-escalate."
The Kobeissi Letter characterized the presidential address as "incredibly puzzling," arguing that rather than providing reassurance, it would amplify anxiety across financial markets.
"The market, which was finally beginning to show some signs of calming, is now highly agitated, with US oil prices back to $104/barrel, stocks down sharply, and the bond market melting down again," it added.
"Ironically, President Trump is now back to solving the problem he fixed earlier this week: How will he contain the market?"
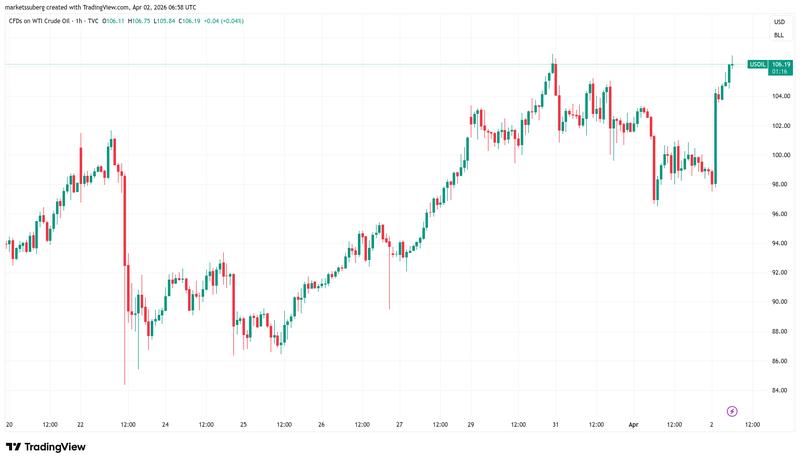
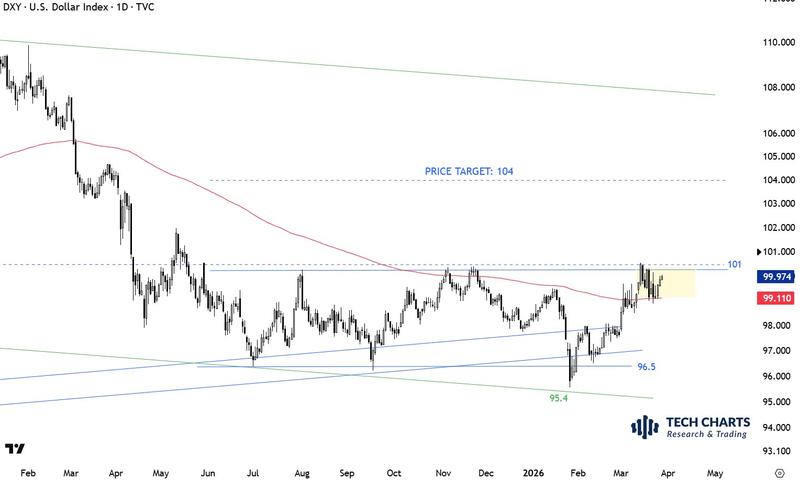
As crude oil prices maintained their position solidly above $100 per barrel, the US dollar index experienced renewed strength, climbing back to the critical 100 threshold during Thursday's session.
Given its historical inverse relationship with Bitcoin price performance, the US dollar index (DXY) had already been forecast to stage a more substantial recovery following its descent to multi-year lows recorded in January.
"DXY stage is set. We are waiting for that breakout confirmation," trader and analyst Aksel Kibar told X followers last week, offering a target of 104 — its highest level since April 2025.
Cryptocurrency market analyst BitBull projected an upcoming expansion phase for the dollar index, warning that such a development would drive risk-oriented assets to fresh lows.
"$DXY looks like a classic downtrend, accumulation and expansion phase. Downtrend has happened. Accumulation has been ongoing. The next will be expansion which will send crypto and stocks to new lows."
Technical analyst identifies repeating BTC bear flag pattern
Meanwhile, certain market observers maintained their attention on Bitcoin's most recent bear flag formation — a technical pattern that similarly presents downside breakdown potential.
According to previous Cointelegraph coverage, current BTC price movements are demonstrating remarkable similarities to a bear-flag support breakdown witnessed during early 2026.
Providing commentary on the situation, Keith Alan, cofounder of trading resource Material Indicators, noted that BTC/USD remains absent of "directional momentum."
"Structurally, $BTC price action is still nearly identical to the prior bear flag structure," he wrote on X.
"Nothing says that it has to continue to mimic that price behavior, but I'm following it like roadmap until price deviates from that path."