
BTC Order Flow Reveals Pressure at $70K Support Level
Sell-side liquidity for Bitcoin hits its highest point in two months, creating conditions similar to January's pattern. Is a downward move imminent for traders?

Bitcoin (BTC) seems to have successfully reestablished the $70,000 level as a foundation of support, yet market participants remain watchful as technical indicators suggest a pattern that bears resemblance to the bull trap witnessed in January 2026.
The sell-side liquidity for Bitcoin has experienced a notable surge throughout the most recent range retest. Crypto trader Ardi's analysis reveals that Bitcoin ask orders have climbed to their highest level in two months. According to the trader's statement,
"Asks on Bitcoin just hit a 2-month high. $1.57B in sell-side liquidity stacked above price vs $1.125B in bids below."
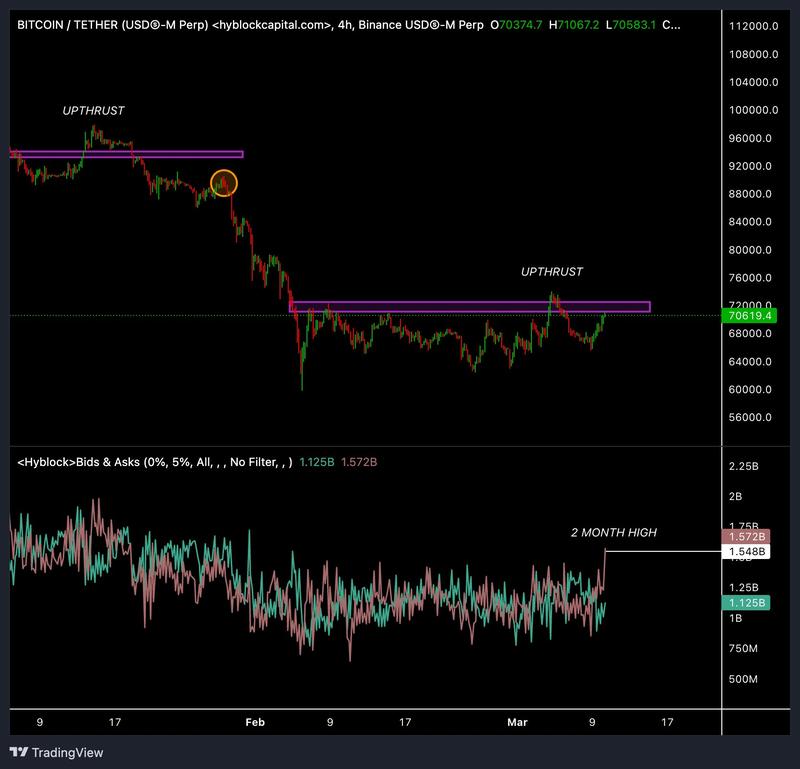
In a 5% range surrounding the current spot price, sell orders outweigh demand by approximately 40%, establishing a more substantial supply barrier positioned above the current market value. Simultaneously, the bid orders create a less robust support foundation beneath BTC's trading price.
Ardi highlighted that the previous similar configuration emerged in January following Bitcoin's brief climb beyond $98,000. A comparable pattern has followed Bitcoin's recent advance past $72,000 before the cryptocurrency retreated toward its range midpoint. When ask liquidity rises during a retest phase, it frequently suggests that market participants are utilizing price recoveries as opportunities to secure profits.
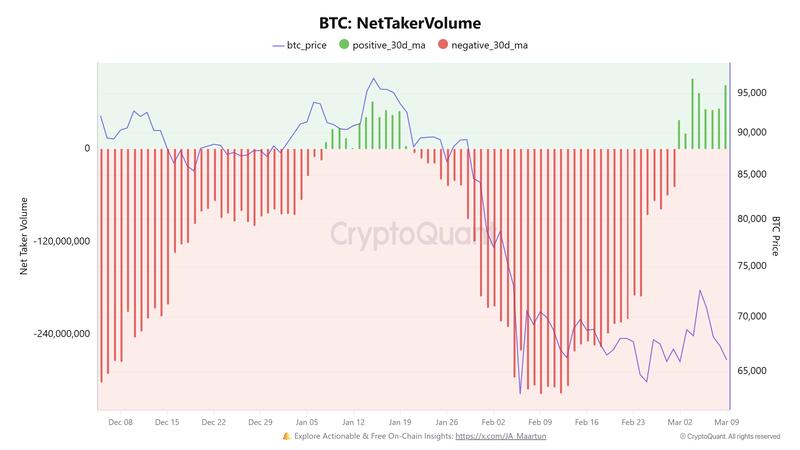
An additional positioning indicator has also shifted in the identical direction. Bitcoin's 30-day moving average for net taker volume maintained a positive reading at $83 million during March, demonstrating heightened purchasing activity executed through market orders.
Will BTC's underwater supply cap its rebound?
Cost-basis information for Bitcoin short-term holders (STHs) reveals that the typical holder acquired their position at considerably elevated price levels. The STH realized price, representing the mean acquisition cost for coins held less than six months, currently rests around $88,900.
Bitcoin researcher Axel Adler Jr. points out that the most substantial supply concentration exists within the $86,000 to $99,000 corridor, where significant coin accumulation took place from November 2025 through February 2026. This price band represents the primary breakeven territory for a substantial portion of the short-term participant base, establishing it as a critical market pivot zone.
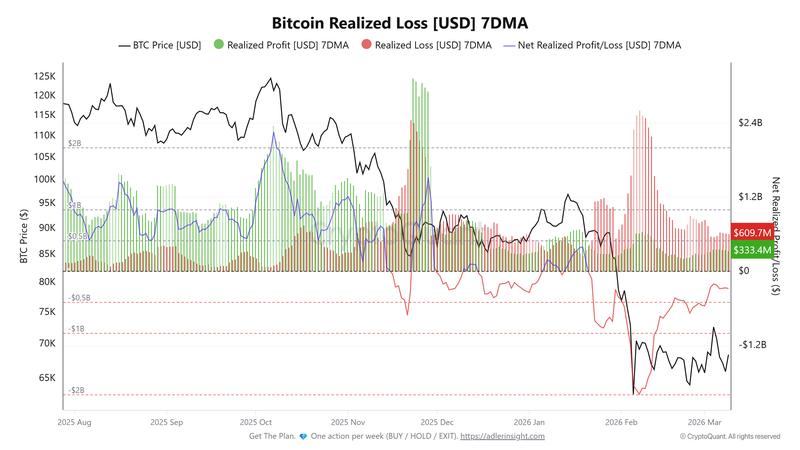
From an encouraging perspective, realized profit and loss metrics demonstrate that selling pressure has started to diminish. Crypto analyst Darkfost observed approximately $611 million in realized losses compared to $346 million in profit during the previous week, resulting in a net weekly profit-and-loss figure of -$264 million.
This number represents a significant reduction from the $2 billion weekly loss that was documented during February's decline beneath $60,000.
When contrasted with the January retest scenario, Bitcoin's current price position sits considerably below the primary short-term cost-basis concentration. This separation restricts the volume of breakeven-motivated selling that generally surfaces during modest price rallies.
Consequently, numerous short-term holders are likely to opt for waiting until higher price levels materialize, potentially approaching the $86,000 mark, instead of liquidating their holdings at a loss following an extended month-long consolidation period.
A recovery beyond the $70,000 to $72,000 trading range alleviates a portion of the immediate-term selling pressure, however a more substantial transformation would likely necessitate Bitcoin recapturing the $86,000 to $89,000 zone, representing the area where the majority of short-term holders achieve their breakeven threshold.