
BTC Maintains $80K Support Through Week's End Despite Predictions of Further Correction
While Bitcoin successfully maintained the $80,000 level throughout the weekend, market analysts anticipate BTC will test lower support levels before resuming its upward trajectory.

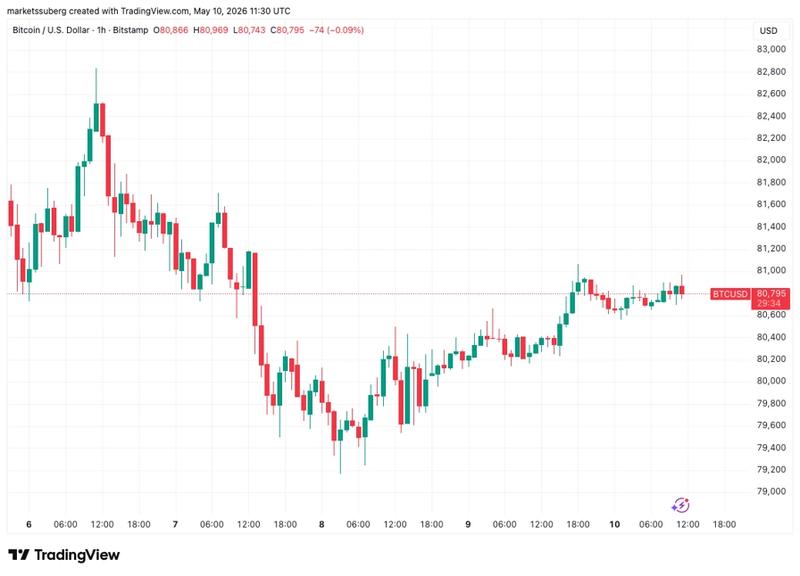
As Sunday's weekly close approached, Bitcoin (BTC) set its sights on the $81,000 level while market participants anticipated a renewed test of support zones.
Key points:
- Throughout the weekend, Bitcoin maintained the $80,000 threshold, though market participants anticipate a pullback to retest a well-known technical indicator.
- The prevailing market sentiment suggests continued upward movement following any potential retest.
- Upcoming US CPI figures are scheduled for release, with Bitcoin markets potentially having already factored in the expected results.
Market Analysts Anticipate BTC Retest Below $80,000
According to TradingView data, BTC price movement trended in an upward direction following a relatively stable weekend period, successfully maintaining levels above the $80,000 threshold.
Following a mid-week advance toward the $83,000 level that ultimately proved unsustainable, market analysts indicated the necessity for BTC/USD to revisit support levels — a view they continued to express.
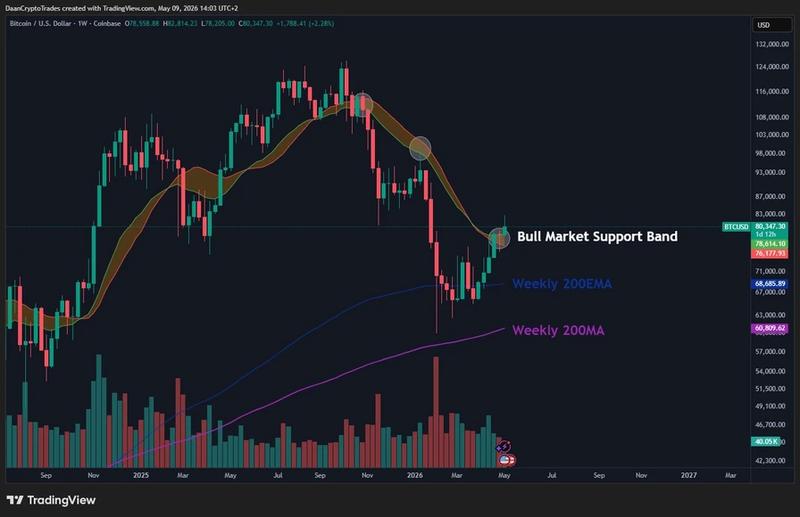
The bull market support band garnered significant attention from traders — comprised of two key moving averages positioned just beneath the $80,000 price point.
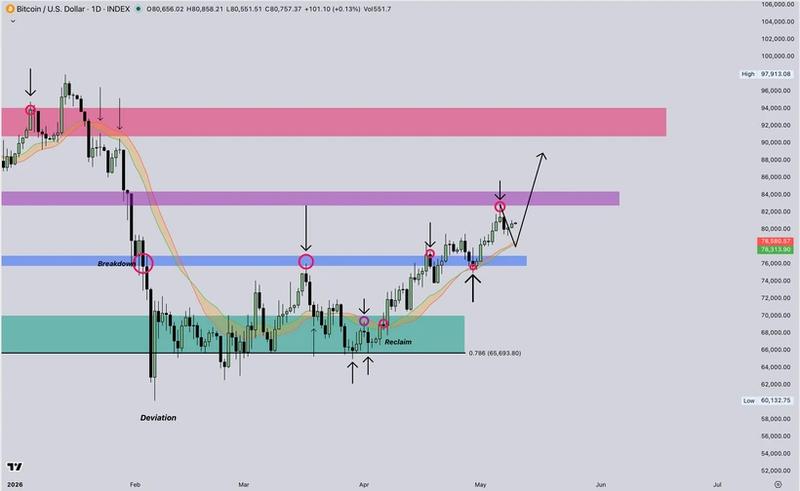
In its most recent X post accompanied by a chart, analytics account Cryptic Trades stated, "On the low-timeframes, after rejecting at the high-timeframe resistance range marked in purple, I believe the most likely outcome is a short-term pullback toward the 2D Bull Market Support Band, which has been a strong reversal zone over the last couple of months."
"As long as price continues to hold above the support band and the broader high-timeframe support range marked in blue around $75K, which aligns with the April 2025 bottoming formation, I believe the most likely outcome remains further upside."
Sharing a similar perspective, trader Daan Crypto Trades characterized the initial movement beyond the support band as "not a clean break."
In a message to his X followers, he explained, "Would want to see a move to at least clear that sticky area around the low $80Ks and hold there for a week or two."
Bitcoin Markets Already Factor In Upcoming CPI Data
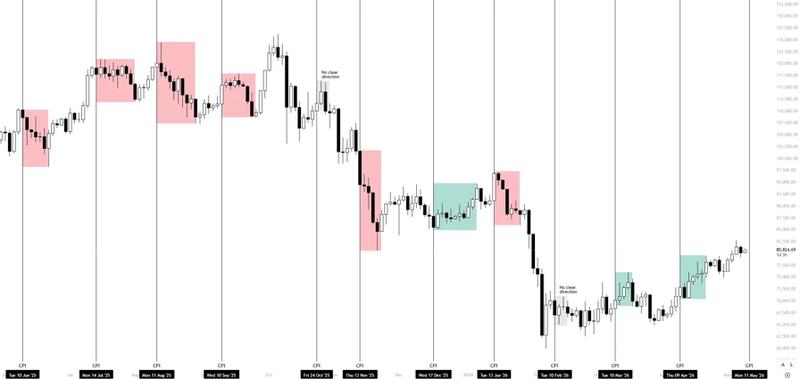
Looking toward the release of updated US inflation metrics scheduled for the following week, trader Killa cautioned about potential obstacles for Bitcoin's price momentum.
The April Consumer Price Index (CPI) report, scheduled for release on Tuesday, was expected to reveal the continuing effects of the US-Iran conflict and elevated oil prices on economic conditions.
In a post on X, Killa stated, "Its priced in."
"BTC has rallied after the last two CPI releases. However, if we follow 2025 CPI price action, we may see bigger players start de-risking into the event counter narrative."
Critical support zones to monitor included the region surrounding the bull market support band, with the $74,000 level becoming relevant should that support level prove insufficient.
Killa further noted, "I would watch for liquidity sweeps around this pivot to signal the next move."