
BTC Climbs Back to $65K While S&P 500 Recovers from Two-Week Low Amid US-Iran Tensions
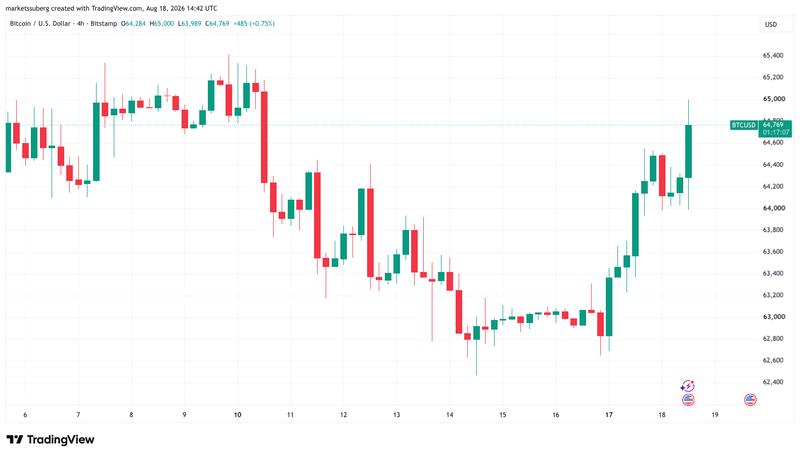
For the first time in seven days, Bitcoin climbed back to the $65,000 mark as BTC experienced renewed price fluctuations following US statements that the Strait of Hormuz remains "open and operating."

Following Tuesday's opening bell on Wall Street, Bitcoin (BTC) touched the $65,000 level as equities markets staged a recovery despite ongoing geopolitical tensions.
Key points:
- Bitcoin climbs to $65,000 for the first time since Aug. 10 while risk assets respond to evolving US-Iran developments.
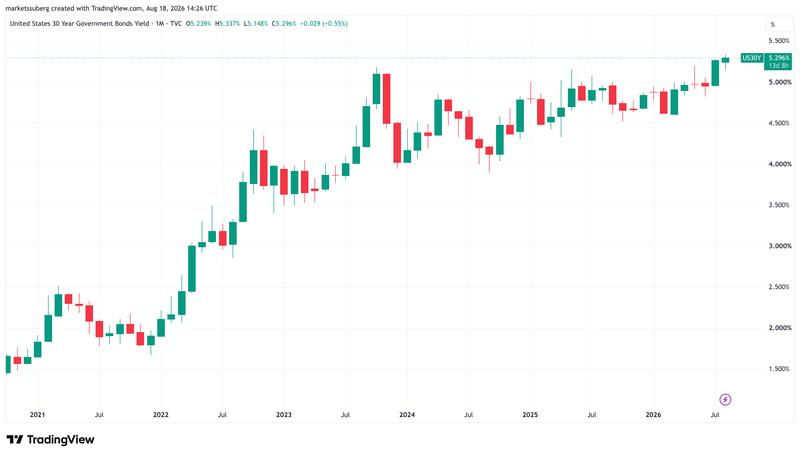
- Analysts highlight concerns over rising US 30-year bond yields, which reached 29-year peaks of 5.34%.
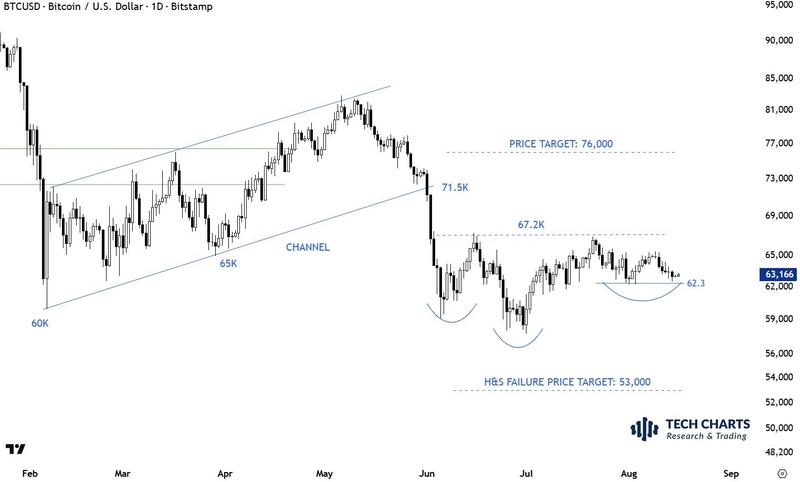
- Technical analysis of BTC price suggests a critical juncture for a potential head-and-shoulders bottom formation.
Bitcoin moves independently from equities as Trump declares Strait of Hormuz "open"
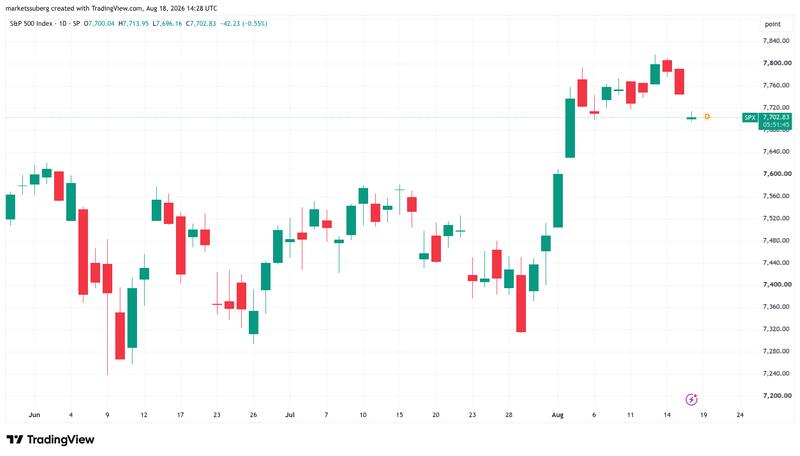
According to TradingView data, BTC/USD extended its weekly advance while the S&P 500 recovered from 7,696, marking its weakest point since Aug. 4.
The move followed US president Donald Trump's Truth Social post featuring a map depicting the shuttered Strait of Hormuz oil passage, which he labeled "new US territory."
Control over the Strait of Hormuz remains contested between the US and Iran, with Trump warning US ally Oman of potential military consequences regarding its cooperation with Iran on implementing toll charges for shipping vessels. In a follow-up post, Trump made clear that additional diplomatic efforts with Iran were not being considered.
"There are no talks or conversations going on, or scheduled, with the Islamic Republic of Iran. The Naval Blockade remains in full force and effect. The Hormuz Strait is open and operating. All water mines have been removed or detonated,"
he wrote.
Similar to Monday's trading action, crude oil prices remained relatively stable, with WTI crude trading down 1% at $84 per barrel at the time of publication. Meanwhile, US government bonds exhibited continued stress, as the 30-year yield climbed to 5.34%, representing its highest level since January 2007.
"Bond prices are sending warnings," BNY Mellon analyst Geoff Yu wrote in a research note quoted by the New York Times. Yu said that the surge came as "investors demand more compensation for inflation risk," while also attributing the upside to government borrowing.
BTC price reaches critical moment for potential recovery
In an update shared with X followers regarding BTC/USD, trader and analyst Aksel Kibar highlighted the completion point of a possible reverse head-and-shoulders formation at $62,300.
"If $BTCUSD is going to rebound, it has to come from here," he argued on Monday.
Kibar identified a potential downside target of $53,000 should the head-and-shoulders pattern break down, while suggesting $76,000 as a possible upside objective if the recovery proves sustainable.
As Cointelegraph previously reported, investors holding Bitcoin at a loss were playing a role in the cryptocurrency's struggle to push through resistance levels. The recovery to $64,500 also fell short of a key overhead trend line identified as the 50-month exponential moving average (EMA). This moving average currently serves as resistance at $65,827.