XRP Network Fees Plummet 91.5% While Market Eyes Critical $0.65 Support Level
Network usage and holder profitability on XRP reach historic lows, with market participants zeroing in on the crucial $0.65 to $1 price range.

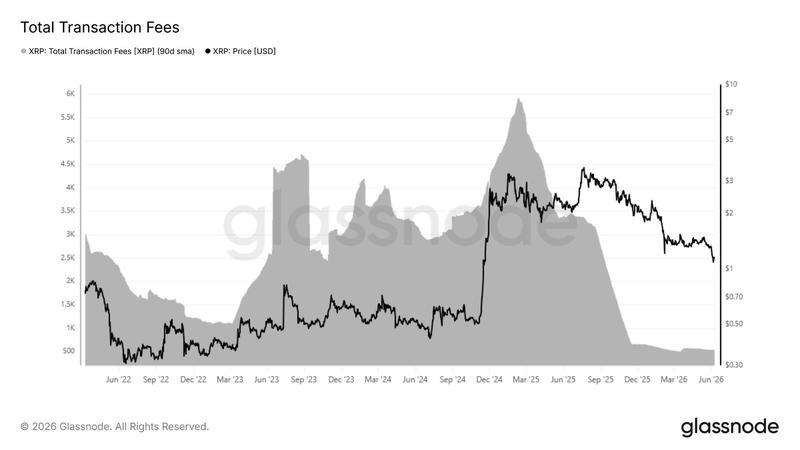
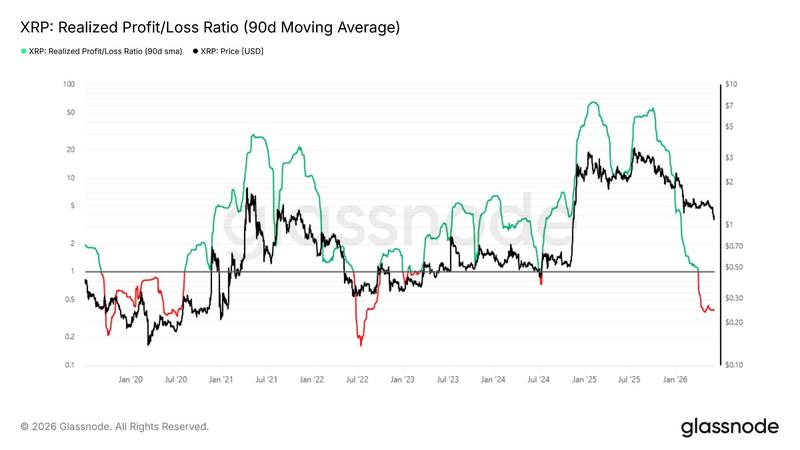
The onchain metrics for XRP (XRP) have experienced a dramatic downturn since reaching their 2025 highs. Data from Glassnode reveals that the 90-day moving average for network fees has collapsed by 91.5%, while the ratio measuring realized profits against losses has plummeted from 50 down to 0.38.
This significant reduction in both network activity and investor returns occurs as market participants have pinpointed the $0.65-$1.00 price corridor as a critical zone of focus.
Network capitulation replaces XRP profit-taking activity
Glassnode data indicates that the 90-day simple moving average for total fees collected on XRP's network has decreased dramatically to merely 500 XRP from a February high of 5,900 XRP, marking a substantial 91.5% contraction.
Network fee metrics serve as a reliable indicator of transaction demand on blockchain networks. This steep decline suggests a significant reduction in network engagement following the speculative rally that propelled XRP beyond the $3 threshold during 2025's initial months.
The behavior patterns among XRP investors have undergone a notable transformation. According to Glassnode's analysis, the 90-day realized profit-to-loss ratio for XRP has declined to 0.38, which translates to market participants crystallizing $1 in losses for each $0.38 in realized gains.
During January and July 2025, as XRP's price approached its peak of approximately $3.40, this ratio surged to 50, reflecting widespread profit-taking activity dominating onchain movements. The situation has now completely inverted. This shift demonstrates that a greater proportion of onchain transactions involve coins being sold at prices below their original purchase cost, a characteristic behavior typically observed during market capitulation events.
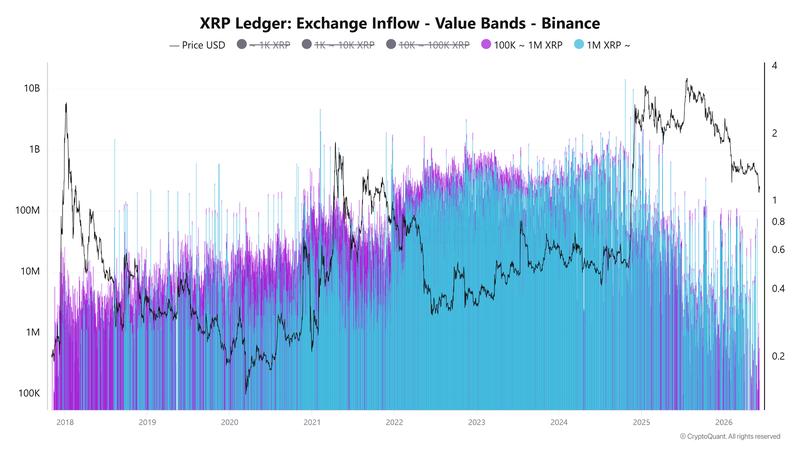
Meanwhile, exchange flow data provides an alternative perspective on holder behavior patterns. Crypto market analyst Pelin Ay observed that transactions exceeding 1 million XRP flowing into Binance have experienced a downturn since XRP reached its 2025 zenith.
Looking at historical patterns, significant market corrections have typically been preceded by substantial increases in both the 100,000–1 million XRP and 1 million-plus XRP inflow categories, as major holders transferred their tokens to exchange platforms.
Present data reveals a continuous decrease in exchange-directed XRP transfers from major holders, with incoming flows from the 100,000–1 million XRP and 1 million-plus XRP segments declining by 15% and 20%, respectively, since October 2025.
According to the analyst's assessment, the recent price deterioration appears to be more strongly correlated with liquidations driven by leverage positions and broader risk-aversion trends rather than aggressive selling by large-scale holders.
Critical accumulation zone identified at $0.63
The weekly price chart for XRP reveals a concentration of important technical levels situated between $0.65 and $1.00.
A substantial fair value gap exists within the approximate range of $0.63 to $1.00, which formed during XRP's explosive upward movement in the closing months of 2024. The asset's price has already begun retracing toward this zone following the breakdown of support in the vicinity of $1.40.
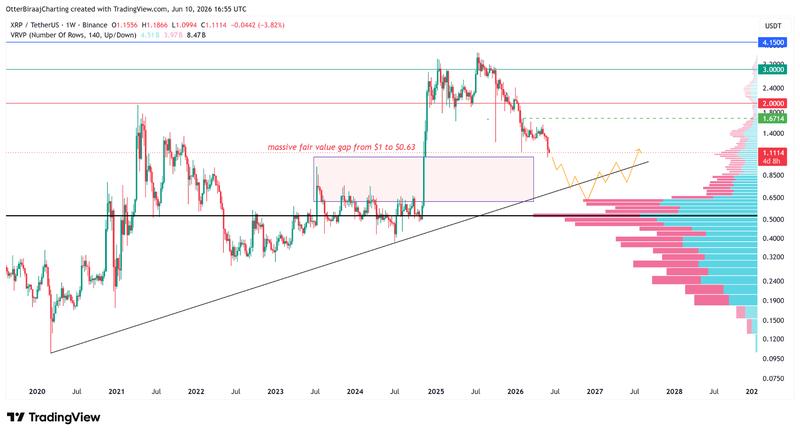
Analysis of the visible-range volume profile indicates comparatively thin trading activity beneath present price levels until reaching a high-volume node in the $0.50–$0.65 range. The point of control, representing the price level with the greatest concentration of traded volume, is positioned near $0.52–$0.55.
This particular region corresponds with XRP's five-year ascending trendline, which is forecast to converge near the $0.60–$0.65 level during the upcoming months.
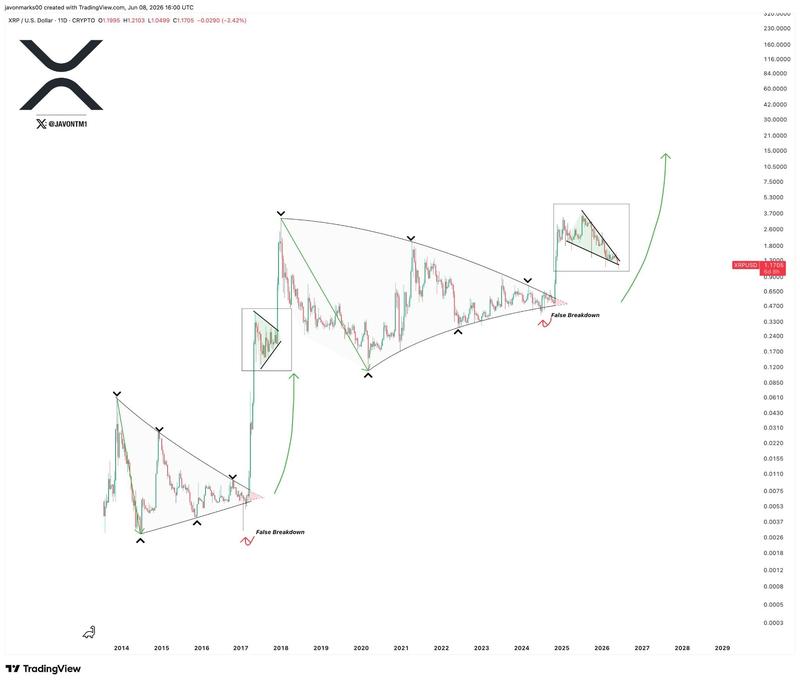
Several traders have already begun viewing this zone as an optimal accumulation territory. Trader Crypto Patel has designated the $1.00 to $0.60 range as an attractive buying opportunity, while market analyst Javon Marks has reaffirmed his long-term breakout projection of $15–$18, which would constitute an approximately 1,100% gain.