
XRP Faces Three Bearish Indicators Pointing to Sub-$1 Drop in June
Technical analysis reveals XRP developing both head-and-shoulders and bear flag patterns on lower timeframe charts, suggesting potential decline beneath the $1 threshold in upcoming sessions.

Multiple bearish technical formations are emerging on XRP (XRP) charts throughout this month, targeting price levels beneath the $1 mark.
Key takeaways:
- Lower timeframe charts for XRP display developing head-and-shoulders and bear flag patterns.
- Additional on-chain indicators point toward diminishing demand or capitulation psychology among market participants.
Head-and-shoulders setup hints at 10% XRP decline
Beginning on June 5, XRP's price action has developed what technical analysts identify as a head-and-shoulders (H&S) formation.
This pattern emerges when price action creates three distinct peaks above a shared neckline support level, with the central peak—referred to as the "head"—reaching higher than the flanking peaks known as the "shoulders."
Typically, an H&S formation completes when price action decisively penetrates below the neckline support, with the projected downside calculated by measuring the pattern's maximum height and subtracting it from the breakdown point.
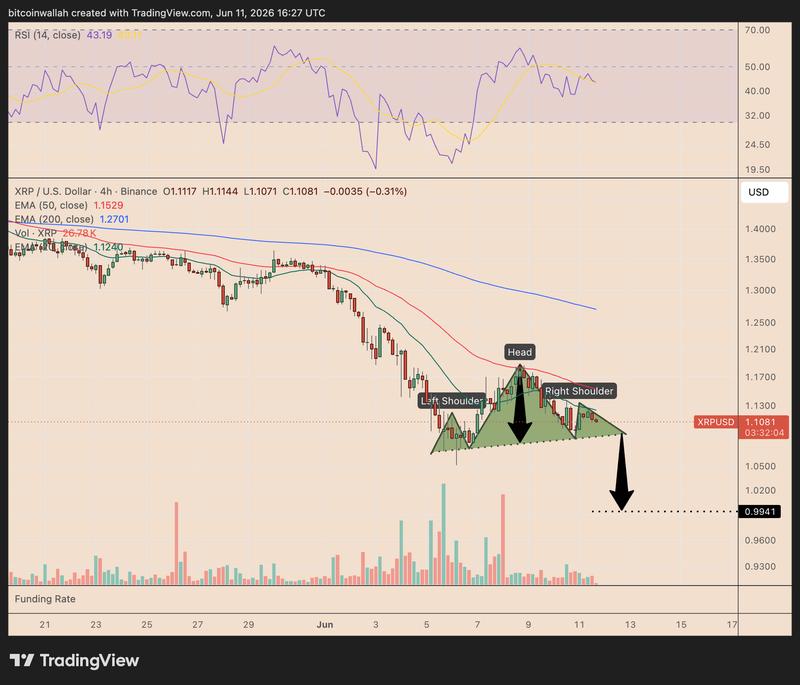
By Thursday's trading session, XRP appeared to be constructing the pattern's right shoulder, with an initial decline toward the neckline support positioned near $1.09 in sight.
Following the established technical principle, the projected June target stands at approximately $0.99, representing roughly a 10% decline, should price action breach below the neckline level.
On the other hand, a definitive breakout above the right shoulder's apex around $1.12—a price level that coincides with the 20-period exponential moving average (20-period EMA, green) visible on the four-hour timeframe—could negate the H&S formation.
Should this scenario unfold, XRP could potentially advance toward the 50-period EMA (red) positioned near $1.15, representing a 4.5% gain from present price levels.
Another bearish setup hints at a lower XRP price target
The four-hour timeframe for XRP additionally reveals a bear flag formation, reinforcing the bearish outlook for a move below $1.
Bear flags develop when price action consolidates within an upward-sloping channel following a steep decline. This pattern characteristically signals a temporary pause before the preceding downward trend continues.
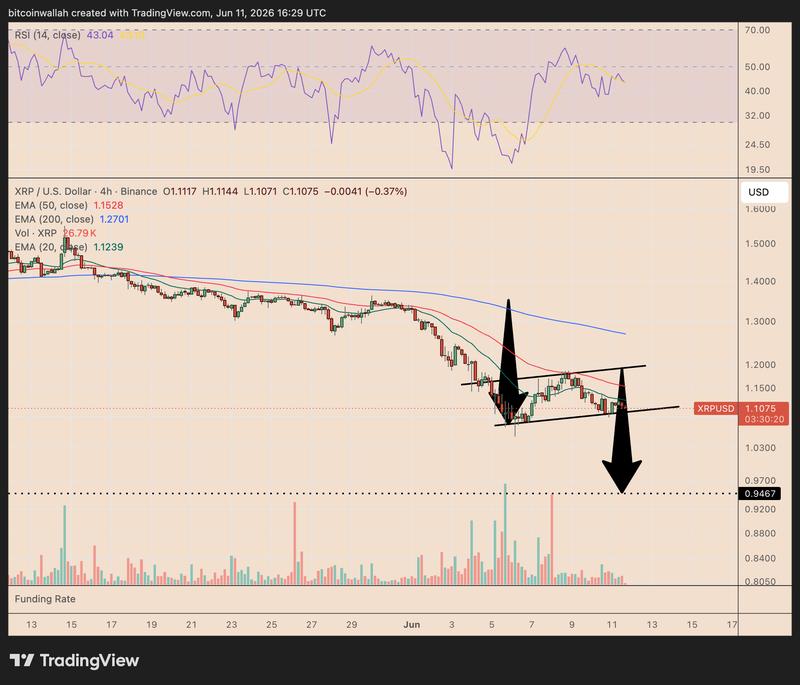
During Thursday's session, XRP was challenging the flag's lower boundary trendline positioned near $1.10. A conclusive four-hour candle close beneath this threshold would validate the breakdown.
When applying the established technical methodology, the bear flag's downside objective rests near $0.94, indicating roughly a 15% decline from current trading levels.
The relative strength index (RSI) hovering near 43 reinforces the bearish perspective, demonstrating weakened momentum beneath the neutral threshold of 50.
Nonetheless, a recovery above $1.12 would undermine this formation. A more substantial advance beyond the 50-period EMA positioned near $1.15 might postpone the selloff and propel XRP toward the flag's upper boundary trendline near $1.18–$1.20.
On-chain data points to dip toward $0.96
Analysis of XRP's MVRV pricing bands indicates the price maintains additional downside potential toward the lower green zone.
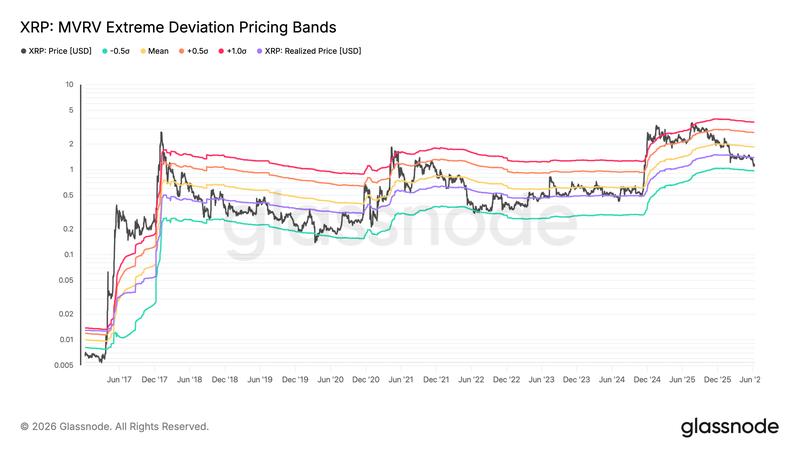
For those unfamiliar with the metric, MVRV evaluates XRP's current market value against the mean price at which tokens were last transferred on-chain. Put simply, this indicator reveals whether holders are experiencing substantial unrealized gains or losses.
When price action approaches the upper bands, market conditions are typically characterized as overheated. Conversely, when it descends toward the lower bands, this frequently indicates market stress, declining demand, or capitulation behavior.
Throughout previous market cycles, XRP's lower green band has functioned as a gravitational pull during bear markets. Price declined toward or penetrated below this identical zone during significant downturns in 2018, 2020 and 2022 before eventually establishing stronger support.
The subsequent significant downside objective is located near the lower green band around $0.96, approximately 13% beneath current price levels should historical patterns recur.
This article is produced in accordance with Cointelegraph's Editorial Policy and is intended for informational purposes only. It does not constitute investment advice or recommendations. All investments and trades carry risk; readers are encouraged to conduct independent research.