
Traders' Growing Confidence Pushes Bitcoin Toward $70K Target as Order Book Data Turns Bullish
Bitcoin's path to recovery gains momentum with bullish RSI divergence and favorable bid-ask metrics pointing toward $70,000 as the next significant price level.

Following last week's yearly bottom at $59,000, Bitcoin (BTC) is experiencing renewed purchasing interest. Liquidity patterns and order book metrics indicate an impending upward movement, with over $2 billion in short liquidations clustered around the $65,000 mark. The bid-ask ratio for BTC has maintained a positive stance continuously since the previous Friday.
This transformation in trader positioning and market psychology corresponds with a constructive chart formation that projects price targets within the $67,000–$70,000 corridor.
Bulls make efforts to recapture control around key support levels
The recent price recovery of Bitcoin toward $63,500 came after the emergence of a bullish divergence signal between price action and the relative strength index (RSI) visible on the four-hour timeframe. During the sell-off in early June, the price established a lower low while the relative strength index (RSI) registered a higher low. This indicator suggested weakening downward pressure prior to buyers entering the market.
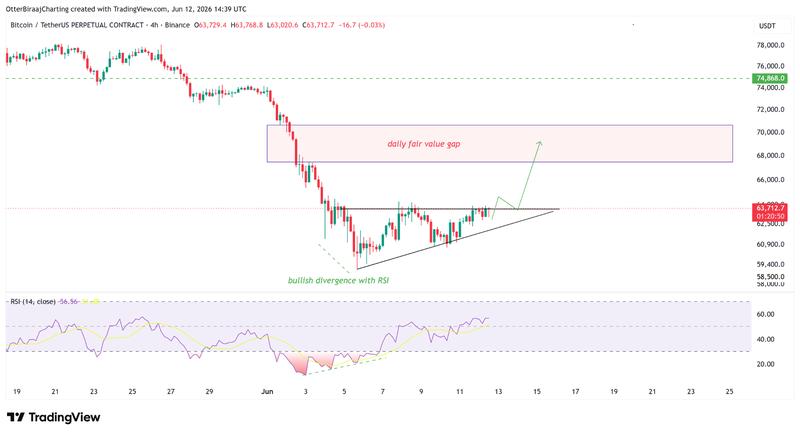
Additionally, Bitcoin is currently consolidating within an ascending triangle formation. Should a breakout be confirmed, the projected target encompasses the daily fair value gap spanning from $67,500 to $70,500, representing a zone of price imbalance or liquidity void created during the recent corrective phase in the market.
Order book dynamics provide additional confirmation for this potential advance. Information from Hyblock reveals the bid-ask ratio has sustained a positive value of 0.05 since Bitcoin reached its yearly bottom at $59,000 on the previous Friday. This indicator measures aggressive purchasing and selling behavior. When the reading is positive, it indicates that buy-side market orders have been marginally exceeding sell-side orders.
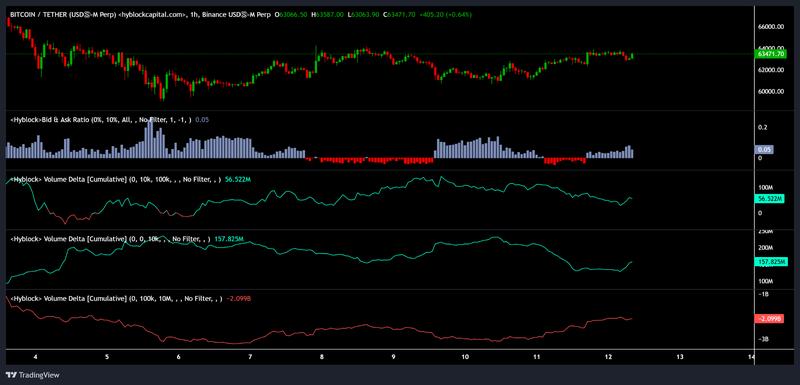
Cumulative volume delta (CVD) metrics provide an additional dimension of confirmation. Smaller trading groups (orders up to $10,000 and $100,000) have demonstrated enhanced purchasing activity totaling $53 million and $157 million, respectively, whereas the largest market participants (orders between $100,000-$10 million) have substantially diminished net selling pressure by approximately $900 million.
Cryptocurrency analyst Kripto Holder identified a $2.68 billion concentration of short-liquidity positioned near $64,600, characterizing it as the principal upside liquidity zone.
According to the analyst, Bitcoin's capacity to maintain levels above $63,000 amid escalating tensions in the US-Iran conflict strengthens the recovery narrative. Spot CVD inflow patterns also signal genuine demand from spot market participants.
Bitcoin must recapture $66,000 level in near term: Analyst
Market analyst PILTR observed that BTC's long exposure has shown steady growth throughout the last five days. Present positioning data reveals 237 long levels compared to 128 short levels, generating an estimated positive imbalance of approximately $4 billion.
These price targets correspond closely with the technical assessment from crypto trader Ardi, who contends that Bitcoin remains confined within a bear pennant structure subsequent to its drop from $83,000 down to $59,000. The analyst pinpointed $64,000 and $66,000 as the two most critical price levels for the ongoing recovery phase.
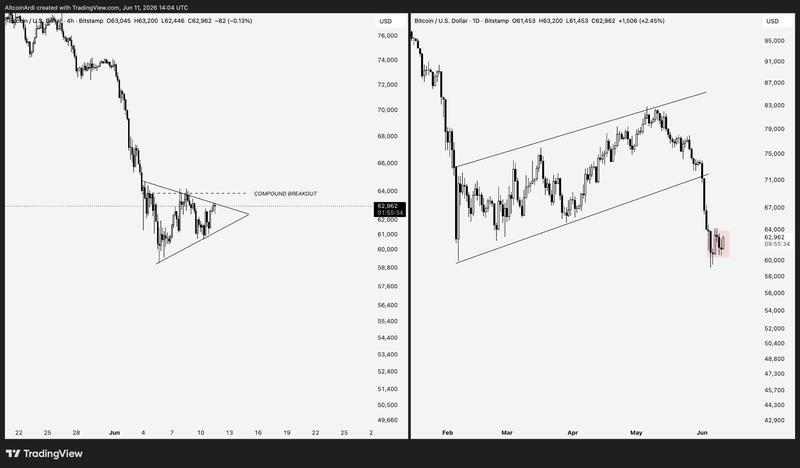
In Ardi's view, a successful breach above $64,000 would eliminate both horizontal resistance barriers and the pennant pattern, providing Bitcoin with greater potential for upside continuation. The subsequent obstacle is positioned around $66,000, a previously significant range support threshold that currently functions as resistance.
Successfully recovering that region would bolster the argument for an advance into the liquidity concentration above current price levels and the remaining unfilled fair value gap situated between $68,000 and $70,000.
Nevertheless, PLTR also identified weekend positioning dynamics as a short-term consideration. The analyst pointed out that weekly profit-taking activity frequently generates conflicting flows heading into weekends, particularly following an extended period of long exposure accumulation.
This article is produced in accordance with Cointelegraph's Editorial Policy and is intended for informational purposes only. It does not constitute investment advice or recommendations. All investments and trades carry risk; readers are encouraged to conduct independent research.