
Technical Analysis Points to Potential $100K Bitcoin Rally By October
Key technical indicators including a double-bottom pattern, bullish RSI divergence on weekly charts, and significant whale movements signal BTC may be approaching a critical breakout level.

Technical indicators on Bitcoin (BTC) charts are pointing toward a potential rally that could push BTC price to $100,000 as early as September.
Key takeaways:
- Bitcoin is painting a potential double-bottom and bullish divergence pattern.
- BTC price must break above a resistance confluence near $66,700
Potential 60% BTC price increase suggested by double-bottom formation
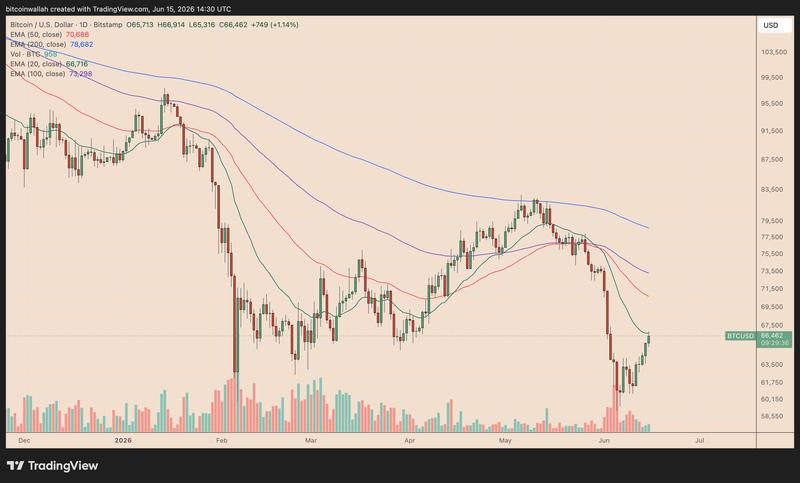
From its recent bottom beneath $60,000, BTC climbed 13.25% higher, driven by renewed risk appetite throughout global markets following a preliminary ceasefire agreement between the US and Iran.
This upward movement drove BTC back in the direction of $67,000 on June 15, following a wider relief rally in risky assets after the geopolitical development pushed oil prices downward and eased immediate inflation concerns.
At this point, Bitcoin's three-day chart is displaying what could be a double-bottom reversal pattern forming around the $60,000 support level.
The $60,000 zone has now served as a launch pad for BTC rebounds twice in 2026, bolstering the argument that market participants are actively protecting the identical demand area that provided support during previous market pullbacks.
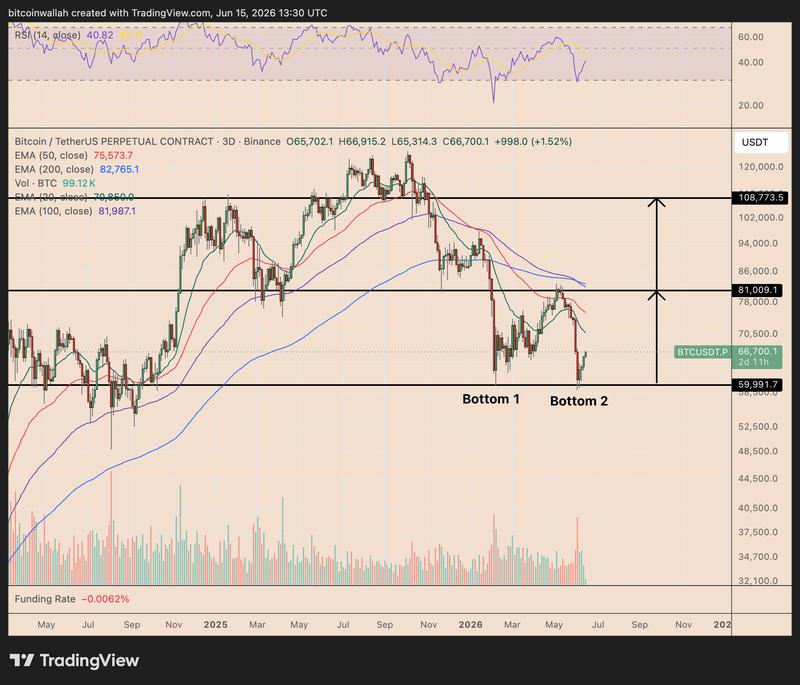
The initial bottom took shape around the March low, whereas the most recent bounce occurred following a steep June selloff that temporarily brought Bitcoin down to approximately the same price point. The double-bottom formation stays intact as long as BTC maintains its position above the $60,000 support threshold.
This pattern's neckline is positioned around $81,000, which represents the level where Bitcoin encountered resistance before its most recent downward movement.
Should Bitcoin achieve a convincing close above that threshold, it would validate the double-bottom formation and potentially trigger a measured advance toward $108,000 by August or September, representing an increase of more than 60% from present price levels.
Weekly RSI divergence on Bitcoin strengthens case for $100,000 target
On Bitcoin's weekly timeframe, a bullish divergence is emerging between price action and the relative strength index (RSI) momentum indicator.
While BTC recently posted a lower low around the $60,000–$65,000 support area, the weekly RSI registered a higher low. This divergence indicates that although sellers managed to drive prices lower, they did so with diminishing momentum.
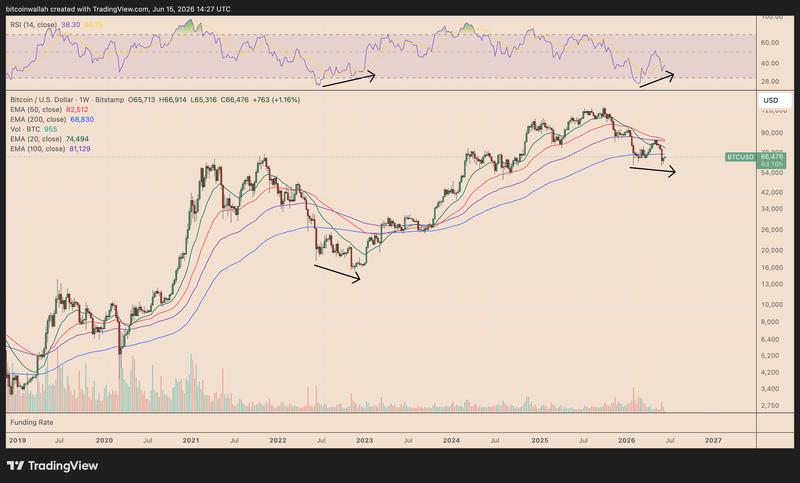
A comparable divergence pattern materialized near Bitcoin's 2022 bear-market floor, when RSI began recovering ahead of price, which subsequently followed with a sustained multi-month rally.
In a Monday post, analyst Jelle said Bitcoin may act "similarly to late 2022 in the coming months."
This developing pattern now reinforces the double-bottom argument for Bitcoin near $60,000. Confirmation still awaits BTC, with critical resistance zones located near the 20-week EMA at $74,500 and the 50-week EMA positioned around $82,500.
Successfully recapturing these price levels would enhance the likelihood of a summer rally reaching toward $100,000. Conversely, a weekly close beneath $60,000 would undermine the bullish technical formation.
Bear flag pattern presents continued downside risk
Bitcoin's near-term chart continues to suggest the possibility of additional downward pressure before the larger bullish reversal pattern receives confirmation.
Currently, BTC is challenging a resistance cluster created by the bear flag's upper boundary line and the 20-day EMA (green) in the vicinity of $66,700.
Should price get rejected at this confluence zone, it could drive the price back down toward the flag's lower boundary line around $63,600, maintaining Bitcoin's position within its bearish continuation pattern.
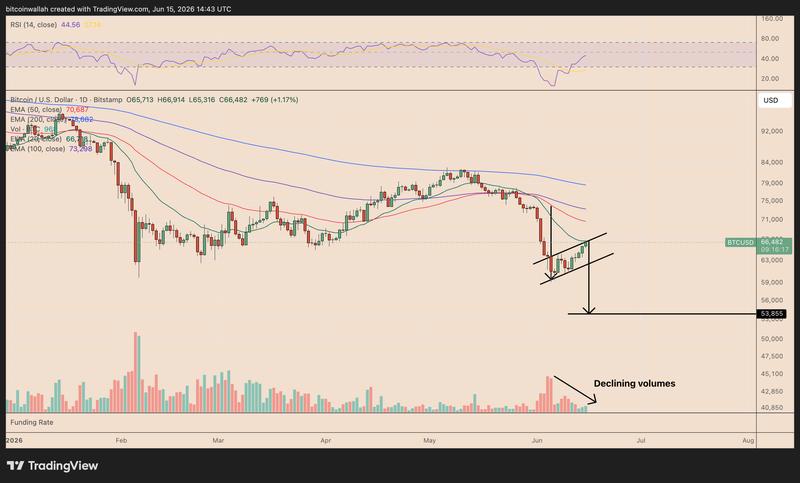
Should Bitcoin post a definitive daily close beneath that lower boundary line, it would validate the bear flag breakdown. Using the height of the preceding selloff as a measurement, the projected downside objective stands at $53,850, representing approximately 20% below current price levels.
Diminishing volume throughout the flag's development raises the probability of this outcome, since weak market participation frequently indicates that the bounce is corrective in nature rather than impulsive.
Increased Bitcoin whale inflows contribute to bearish pressure
The bearish near-term technical picture also corresponds with heightened distribution from Bitcoin whales.
CryptoQuant analyst Darkfrost observed that whale deposits to Binance increased substantially following BTC's recent price correction. Major holders transferred an average of 3,200 BTC daily to the exchange throughout the past month, compared to 1,200 BTC at the end of April.
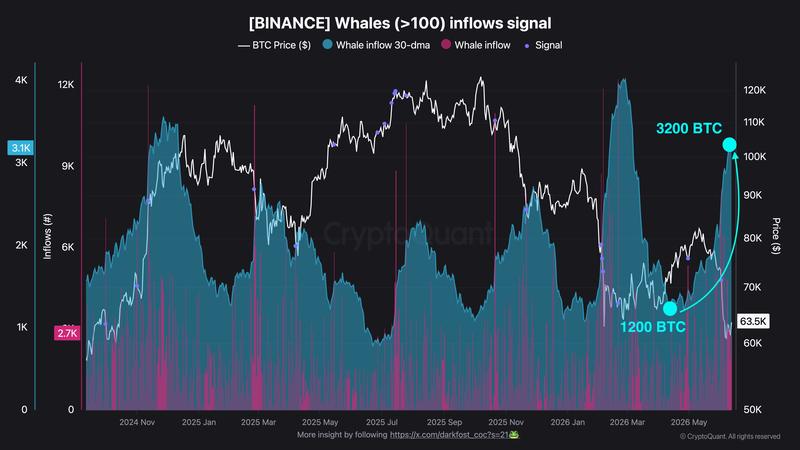
"This trend suggests that many large holders increased their selling activity, or at least their willingness to sell, during the recent downturn," he wrote in a Monday note.