
SOL dominates tokenized stock trading with 95% market share amid price bottom speculation
The Solana network dominated tokenized equity trading with a 95% market share while market participants debate whether SOL's $60 level marks the price floor.

The Solana (SOL) blockchain dominated tokenized equity trading last week, capturing an overwhelming 95% share of all activity across blockchain networks and achieving a record $1.29 billion in trading volume. This milestone arrives while SOL trades over 75% beneath its peak price near $295, creating division among market participants regarding whether the cryptocurrency is approaching a cyclical bottom.
Despite the absence of a clear SOL price recovery that traders eagerly anticipate, onchain metrics for Solana continue showing expansion across multiple categories.
Record-breaking tokenized equity activity on Solana network
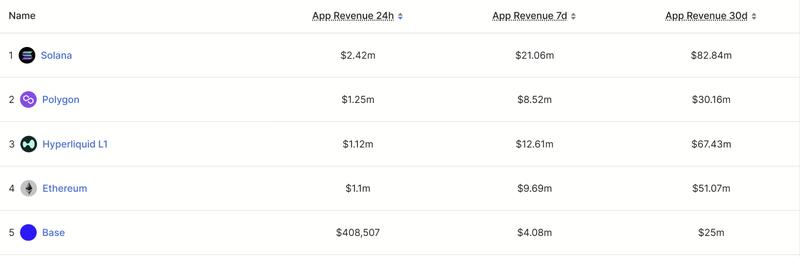
Recent data indicates Solana generated $21 million in application revenue over the past week, surpassing Ethereum, Hyperliquid, and Base networks. Throughout the previous month, applications built on Solana produced $82.84 million in total revenue, outpacing Hyperliquid's $67.43 million and Ethereum's approximately $51 million.
The network has additionally pioneered tokenized equity trading activity on blockchain infrastructure. According to independent analysis from Solana Floor, the platform experienced its most substantial week ever for tokenized stock trading activity, recording $1.29 billion in volume and representing 95% of all cross-chain activity in this category.
Solana Floor's analysis revealed that the previous week's trading volume surpassed the entire preceding month's total, with momentum primarily fueled by the introduction of SPCX, SpaceX's IPO token offering.
Concurrently, Solana's total value locked (TVL) hovers around $5.7 billion. This metric represents the aggregate value of assets deposited within decentralized finance protocols and functions as an indicator of onchain capital engagement.
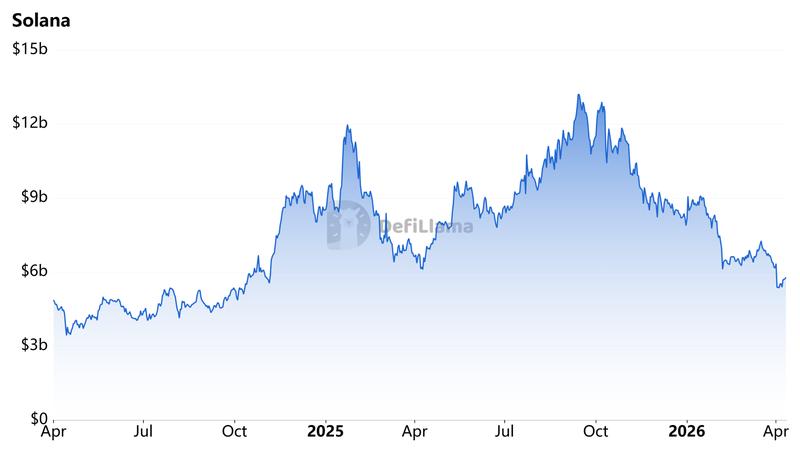
This current figure remains significantly below Solana's TVL record of approximately $13 billion achieved in September 2025, indicating that capital allocated to DeFi protocols has yet to recover to previous cycle highs despite robust transaction volumes and revenue performance.
Market participants divided on optimal SOL accumulation strategy
Divergent perspectives persist among market analysts and traders concerning whether SOL has definitively entered a sustainable bottom formation.
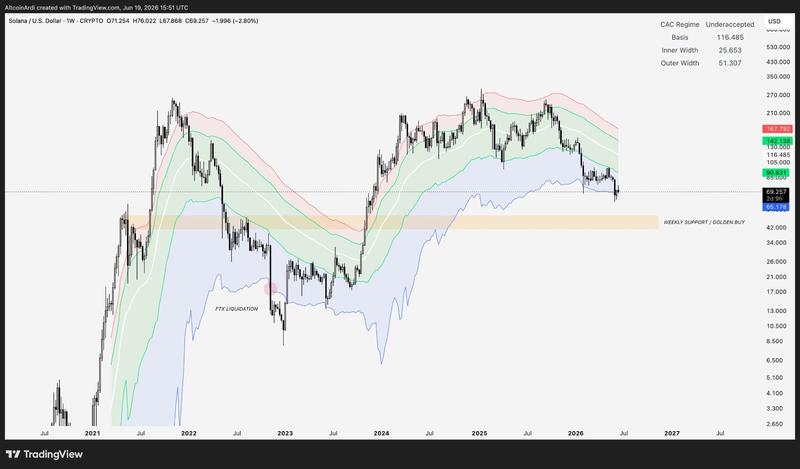
Cryptocurrency trader Ardi stated that Solana is nearing the zone that captures the trader's interest for the upcoming bullish cycle. Ardi observed that SOL has already declined approximately 77% to $60, down from its cycle high near $295.
Referencing historical drawdown compression patterns observed in Bitcoin and Ether cycles, Ardi suggested that an 80%–85% decline would position SOL within the $45-$60 range, representing the most compelling accumulation opportunity.
Cryptocurrency trader Bluntz presented a more optimistic perspective, contending that the price establishing a weekly bullish divergence relative to the relative strength index (RSI) after experiencing an 80% drawdown frequently signals proximity to market bottoms. This trader suggested that SOL could begin trending upward in the near term based on this technical configuration.
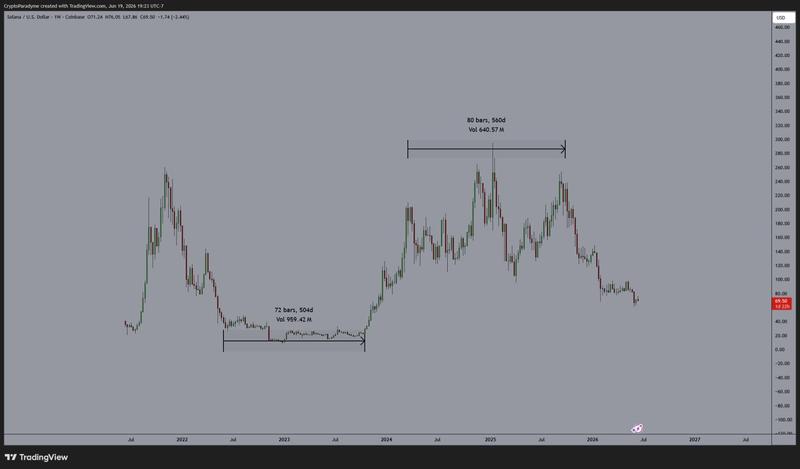
Conversely, crypto trader Dyme recommended a more cautious approach, highlighting that Solana spent approximately 500 days from May 2022 through October 2023 establishing a base structure before its previous significant rally. This historical comparison implies that SOL may need an extended period of consolidation trading before establishing a lasting bottom.
Trading Stable founder Ryan Clark similarly challenged the recent bullish sentiment, observing that SOL remains trading beneath critical weekly 50-period and 200-period simple moving averages. The analyst, widely recognized as HORSE, stated that a recovery above the $90 region would deliver a more convincing technical confirmation.
Currently, the primary discussion revolves around whether SOL can establish sufficient demand to support higher prices before potentially declining to the $45-$60 range.