
Research: Bitcoin's Subdued Peak Suggests Higher Cycle Bottom Than Historical Patterns
The lackluster price action at Bitcoin's 2025 peak represents a departure from historical cycle behavior, yet current data indicates it remains premature to declare a definitive bottom has been established.

Fresh analysis published by Galaxy Digital indicates Bitcoin's current cycle bottom may establish itself at elevated price points relative to historical bear market lows, primarily attributed to diminished speculative activity. The research positions the probable floor in a range spanning $62,000 down to the network's realized price level of $53,600.
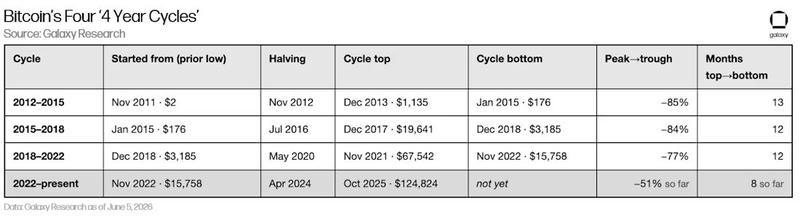
Alex Thorn, who leads research at Galaxy, conducted a comprehensive examination of every Bitcoin cycle peak and trough, observing that the traditional four-year cycle framework remains aligned with BTC's historical timeline patterns. The magnitude of peak-to-trough drawdowns has demonstrated consistent compression throughout successive market cycles, declining from 85% and 84% during initial periods to 77% in 2022 and reaching just 51% in 2026.
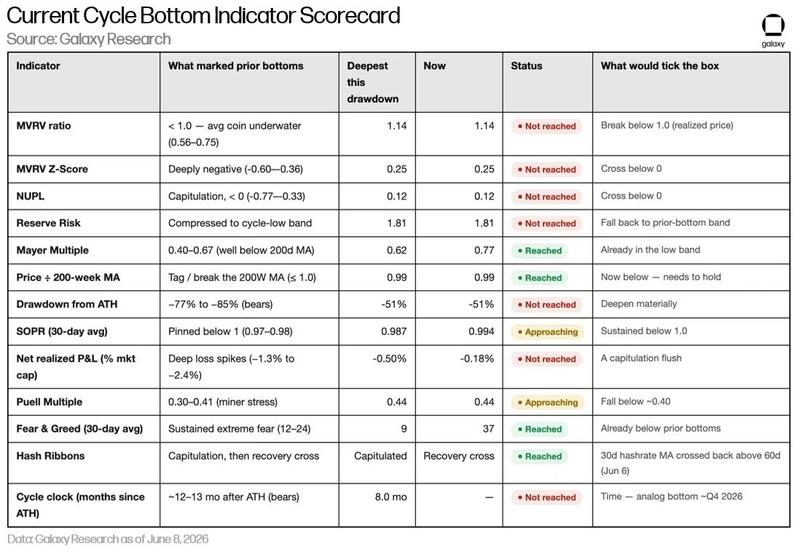
Thorn contended that Bitcoin's peak in October 2025 represented a significant deviation from historical cycle tops. Just two out of eleven conventional topping signals activated, while the Pi Cycle Top indicator, a widely monitored metric, failed to generate a signal for the first time in its history. Bitcoin's MVRV ratio, which measures the relationship between market value and realized value, reached a maximum of 2.29, substantially lower than the range of 2.93 to 5.91 observed in previous cycles. According to the analyst,
"The key insight: a calm top RAISES the floor. Because October's top was so muted, the network's cost basis sits at 43.7% of ATH, vs ~34%, 21%, and 17% in prior cycles."
The analysis additionally revealed that multiple critical bottoming signals remain conspicuously absent. Just four out of thirteen monitored indicators have activated to date, with the majority of more reliable signals still pending.
The historical timeline framework similarly suggests the potential for an upcoming bottom formation. Prior cycle bottoms materialized approximately 12 to 13 months following their respective market peaks, whereas the present drawdown has persisted for roughly eight months.
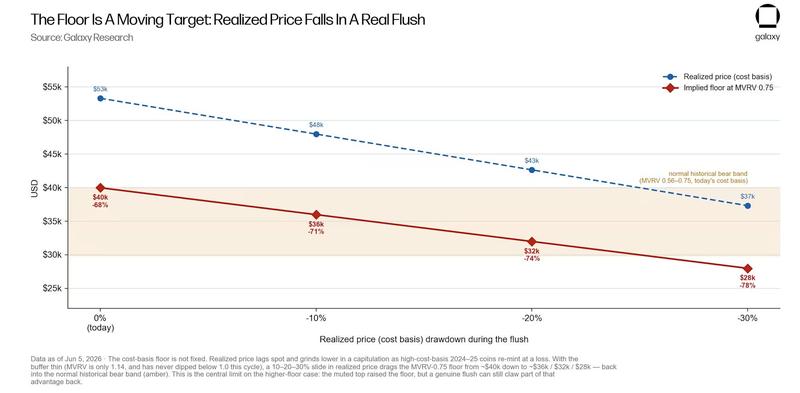
Thorn observed that utilizing the current cost basis figure of $53,600, Galaxy projects a base-case bottom range spanning $40,000 to $46,000. A more severe "washout scenario" targets the $30,000-$37,000 zone, while a more moderate decline could find support near $51,000-$54,000. Regardless of these projections, Thorn also cautions,
"The catch: the floor can move. cost basis is reflexive. in a real panic, coins change hands at a loss and drag the average down. A 10-30% cost basis decline pulls the implied floor from ~$40k back toward $28k."
CryptoQuant data shows continued decline in Bitcoin demand
On-chain metrics from CryptoQuant presently position Bitcoin within a valuation region that has historically corresponded with significant bear-market bottoms. BTC was recently changing hands near $59,000, positioning it approximately 9% above its realized price of $53,600.
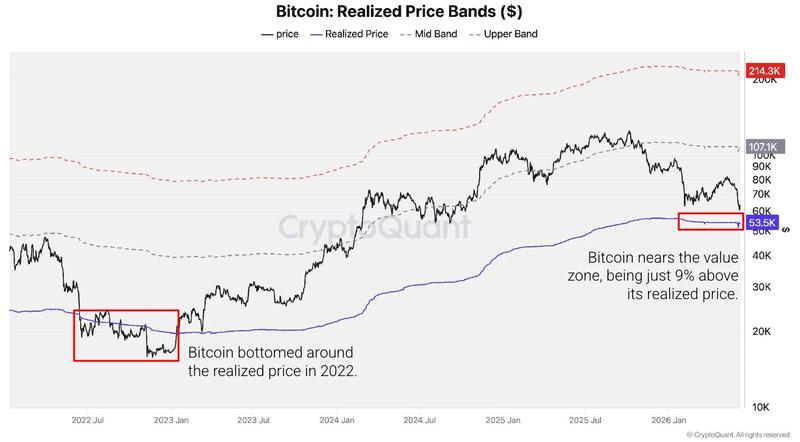
Historical cycle bottoms, including the FTX-induced November 2022 capitulation event, established themselves at or marginally beneath the realized price level, implying the bottom range could once again descend below the $53,600 cost basis threshold and align with Galaxy's base-case projection spanning $46,000 to $40,000.
Demand metrics present a considerably more bearish outlook. CryptoQuant documented a combined weekly reduction of 652,000 BTC across both speculative futures demand and apparent spot demand categories, representing the most severe contraction observed since January 2022. The platform's one-year demand indicator has additionally shifted into negative territory, reflecting fewer BTC purchasers compared to the same period one year prior.