
Is Bitcoin's Bottom In? Four Technical Charts Point to Potential $50K Decline
Multiple technical indicators suggest Bitcoin could still drop to $50,000, even as the cryptocurrency holds above the $60,000 support level, signaling the bottom may not yet be established.

Last week's 13% correction in Bitcoin (BTC) saw bulls successfully holding the line at the $60,000 psychological support level.
Despite this defense, the subsequent recovery hasn't completely eliminated the risk of further downside movement. Market participants continue to caution that a more substantial decline could materialize as concerns over US–Iran tensions combine with diminishing expectations for interest rate cuts, both weighing heavily on appetite for risky assets.
Multiple technical and valuation metrics for Bitcoin are now aligning with this bearish scenario, indicating that BTC might still test the $50,000 level or potentially move even lower within the next several weeks.
Key takeaways:
- Bitcoin is currently hovering around its average production cost of $62,650, facing potential decline toward its electrical cost floor of $50,120.
- According to Glassnode's MVRV bands, BTC has fallen beneath its lower valuation zone, with the subsequent deep-value target positioned near $50,437.
Bitcoin production cost breached on the downside
Among the most significant warning indicators is the Bitcoin production cost model, which evaluates BTC's current market value against the estimated average expense of mining a single Bitcoin.
According to data shared by Charles Edwards, Founder of Capriole Investments, the model indicates Bitcoin is currently trading in proximity to its production cost of approximately $62,650. This suggests that mining operations are, on average, operating near their break-even point at present price levels.
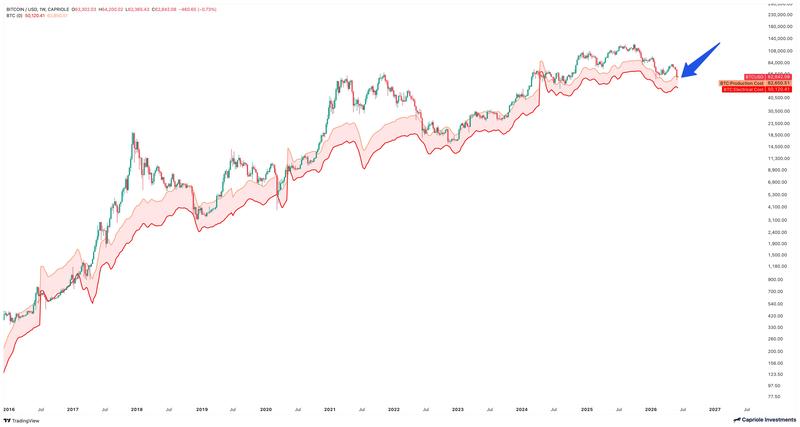
Historically, this price range has functioned as a significant long-term value area. Throughout past bear-market downturns, Bitcoin has typically attracted substantial buying interest when prices declined into the corridor between the production cost and the lower estimate based on electrical costs alone.
According to the chart, that lower threshold is currently positioned near $50,120.
Put differently, BTC is currently examining the upper boundary of a significant miner-cost support region. Should selling pressure drive the price decisively beneath the current production-cost zone, the subsequent major valuation support could be located near the electrical-cost threshold around $50,000.
Realized price metric points to potential $37,500 floor
The realized price of Bitcoin, representing the average acquisition cost for all BTC holders, currently stands near $53,600, based on the chart provided by analyst Follis.
Throughout Bitcoin's history, major cycle bottoms have consistently required the price to first trade beneath the realized price. Historical data shows BTC declined approximately 58% below realized price in 2011, 49% in 2015, 47% in 2018, and 34% in 2022.
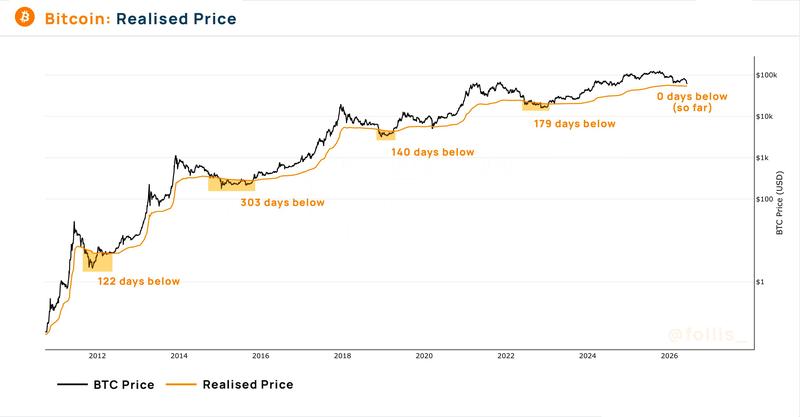
While these percentage declines have gradually diminished over successive cycles, even a comparatively modest 20%–30% decline below the current realized price would suggest a bottom formation zone ranging between approximately $37,500 and $42,800.
To date, Bitcoin has recorded zero trading days below its realized price during this cycle, which stands in stark contrast to 179 days in 2022, 140 days in 2018, 303 days in 2015, and 122 days in 2011.
This historical pattern maintains the likelihood of a bottom formation occurring in Q4 2026. A definitive breach below $60,000 could initially direct BTC toward the realized price near $53,600, subsequently creating the conditions for a deeper capitulation phase below $50,000.
MVRV bands indicate $50,000 remains a realistic target
The MVRV pricing bands for Bitcoin similarly indicate the possibility of a more substantial correction extending toward $50,000.
This model evaluates BTC's market value against valuation zones determined by how overvalued or undervalued Bitcoin appears relative to its historical average. These bands have historically served as price attractors during significant cyclical movements.
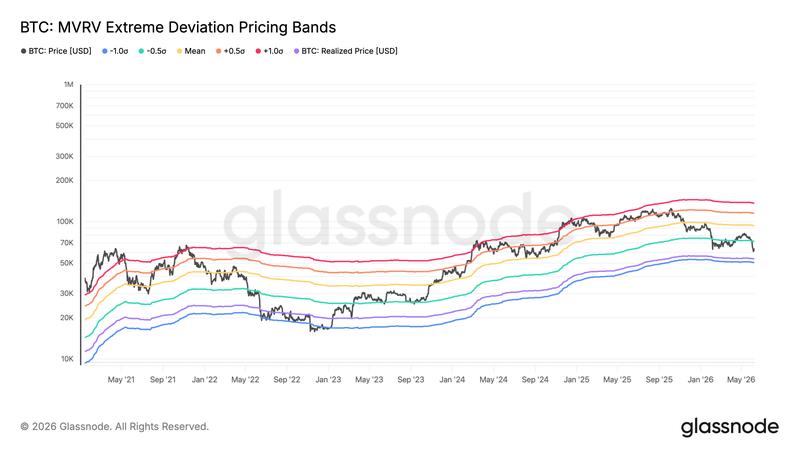
Throughout the 2021 bull cycle, Bitcoin consistently peaked near the upper valuation bands. Subsequently, during the 2022 bear market, prices ultimately penetrated the average band and migrated toward the lower bands prior to establishing a bottom.
A comparable pattern emerged during the 2024 correction, when BTC retreated toward lower valuation zones before staging a recovery.
Currently, Bitcoin is trading near $63,000, already positioned below the model's lower valuation band which sits around $72,035. The subsequent major price magnet is located near the deep-value band around $50,000.
This level also aligns closely with Bitcoin's realized price near $53,600, establishing the $50,000–$53,600 range as a crucial on-chain support cluster.
Therefore, a definitive breakdown below $60,000 would reinforce the argument for BTC to retest this deep-value zone before establishing a sustainable bottom.
Technical bear flag pattern maintains $50,000 downside risk
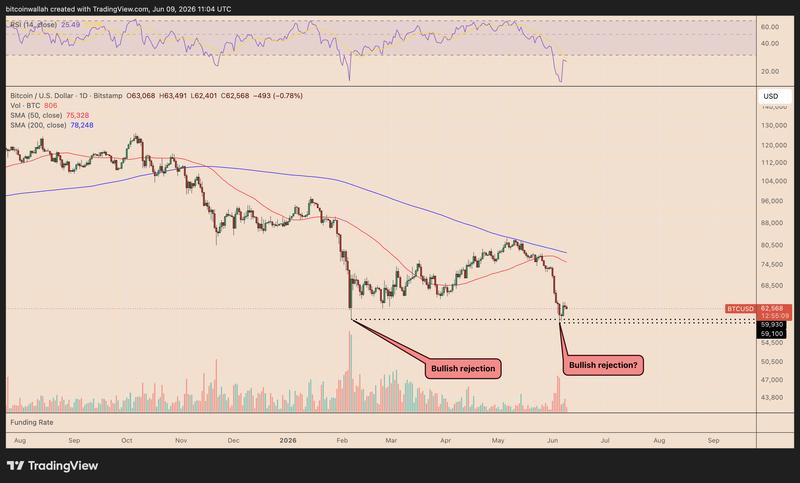
Bitcoin's weekly chart displays a potential bear flag breakdown pattern, with BTC sliding from its ascending consolidation channel following rejection below the 50-week SMA near $91,700.
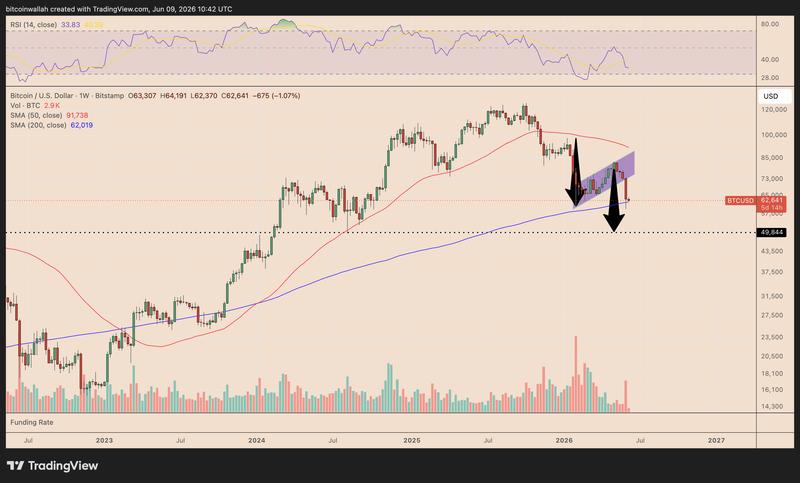
The price action is currently examining the 200-week SMA near $62,000, representing a critical long-term support level. A confirmed weekly close beneath this level would validate the bearish pattern and activate the measured downside objective below $50,000.
Meanwhile, weekly relative strength index (RSI) readings approaching the oversold threshold of 30 demonstrate weakening momentum, reinforcing the perspective that sellers maintain control unless BTC can swiftly recapture the flag support structure.