
HYPE Token Eyes $100 Milestone as Hyperliquid Breaks Out of Bull Pennant
Technical analysis shows HYPE completing a bull pennant formation, targeting prices near $105, supported by robust fundamental indicators strengthening the optimistic outlook.

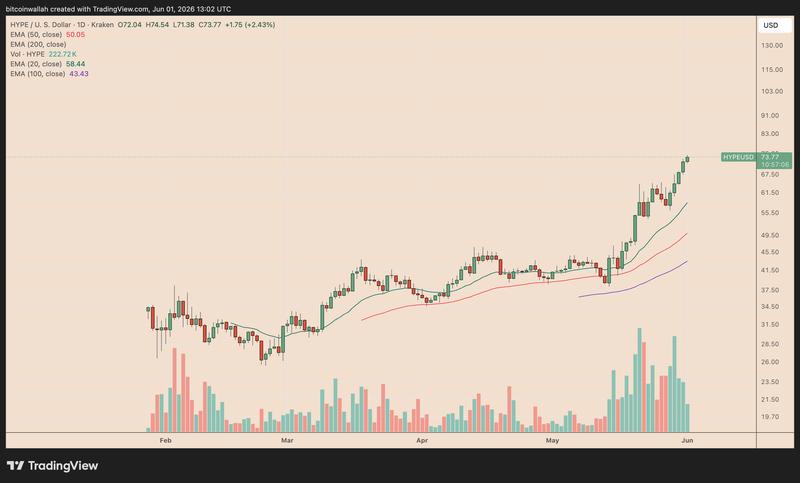
Over a five-day period, HYPE, the native digital asset of Hyperliquid, has surged over 30% to achieve an all-time high approaching $74, with technical chart patterns now indicating potential movement beyond the $100 threshold.
Key takeaways:
- The HYPE token has successfully exited a bull pennant formation, establishing a technical price objective around $105.
- On a 30-day rolling calculation, Hyperliquid has climbed to second position among blockchains ranked by application revenue.
Bull pennant formation points to $105 price objective for HYPE
Following HYPE's breakout from a classic bull pennant configuration, Hyperliquid's price surge appears poised to continue its upward trajectory.
The formation emerged when HYPE's aggressive rally in late May created the pattern's "flagpole," which was then followed by a short consolidation phase within a symmetrical triangle structure. Throughout this consolidation period, the digital asset established lower peak prices and higher valley prices, demonstrating decreasing volatility ahead of its subsequent price movement.
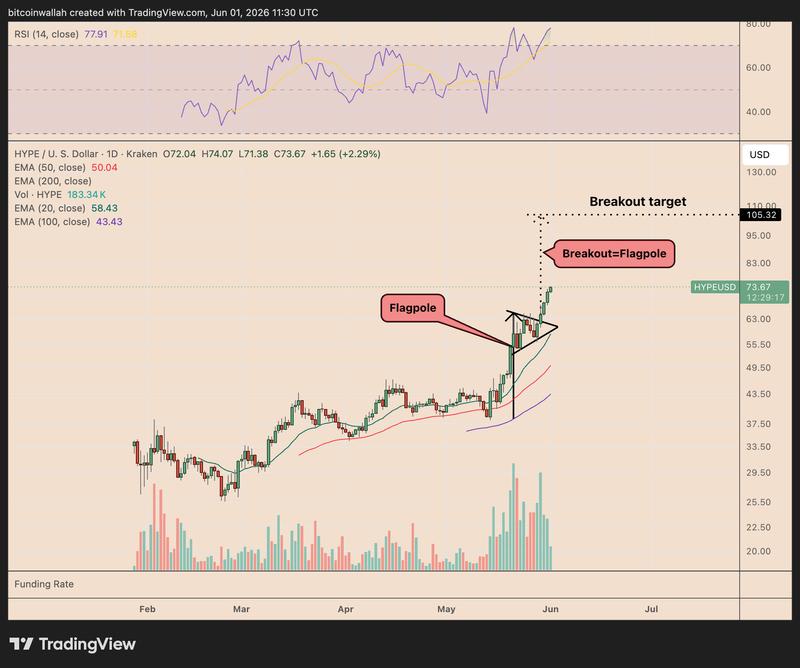
Within the framework of technical analysis, bull pennant configurations characteristically complete when price action pierces above the pattern's upper trend line. Market participants subsequently calculate the potential upside objective by measuring the flagpole's vertical distance and adding it to the level where the breakout occurs.
Throughout the weekend period, HYPE pushed beyond the triangle's top resistance line accompanied by increasing trading volume, indicating heightened confidence supporting the upward move. Should the formation unfold according to traditional expectations, the token's price may advance toward its calculated objective around $105.30 during June or July, representing approximately 45% appreciation from present price levels.
Nevertheless, momentum indicators are showing signs of extension. On Monday, HYPE's relative strength index registered above 77, positioning it within overbought conditions and increasing the probability of a temporary consolidation phase or price pullback.
Should profit-taking intensify, HYPE may revisit its 20-day exponential moving average situated near $58.32 during June. A convincing break beneath that support level would undermine the optimistic configuration and potentially invalidate the pennant breakout scenario.
Derivatives data reflects strong optimistic sentiment for Hyperliquid
Futures market metrics provide an additional optimistic dimension to HYPE's technical chart breakout.
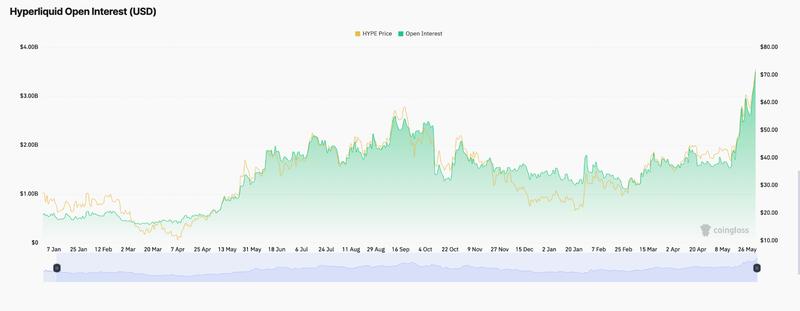
Open interest on Hyperliquid has reached an all-time high of $3.5 billion, rising from approximately $1.41 billion recorded at year's beginning, based on Coinglass data. This substantial increase demonstrates that additional leveraged capital is flowing into HYPE trading venues as the token advances into uncharted price territory.
As of Monday, HYPE's open interest-weighted funding rate measured approximately 0.0050% per eight-hour period and has maintained positive values throughout the majority of the current rally.
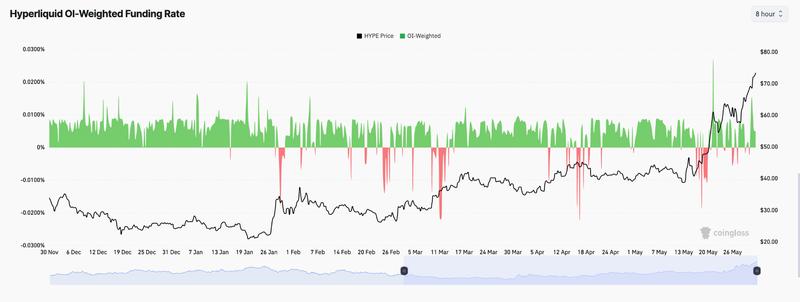
This indicates that traders holding long positions have been compensating short position holders to maintain their perpetual futures contracts, signaling that leveraged market sentiment has favored the bullish direction. Although not reaching extreme levels, the persistently positive funding rate demonstrates a distinct upward bias within HYPE's derivatives marketplace.
In the meantime, traders betting on price declines have experienced greater losses throughout the recent price advance.
From May 20 onward, HYPE has recorded approximately $126.28 million in liquidated short positions, contrasted with $68.85 million in liquidated long positions.
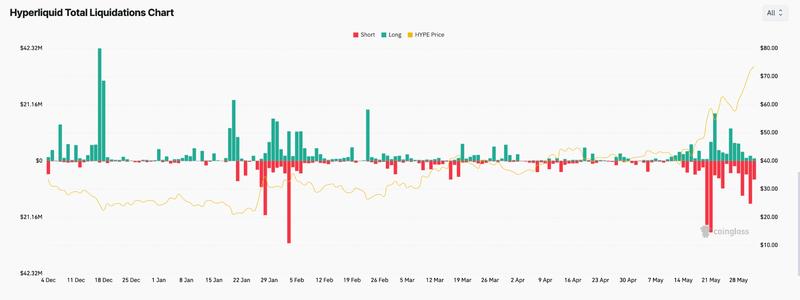
This disparity indicates that pessimistic traders have faced forced position closures as prices climbed higher, generating a "short squeeze" dynamic.
Additional upward price movement in HYPE may expose more short positions to liquidation risk, compelling additional forced buybacks and potentially accelerating momentum toward the $100–$105 target range.
Monthly app revenue positions Hyperliquid ahead of Ethereum
Fundamental factors supporting HYPE are similarly trending positively.
On a 30-day rolling measurement basis, Hyperliquid has surpassed Ethereum to claim second place among blockchains ranked by application revenue, producing $57.9 million, according to DefiLlama data.
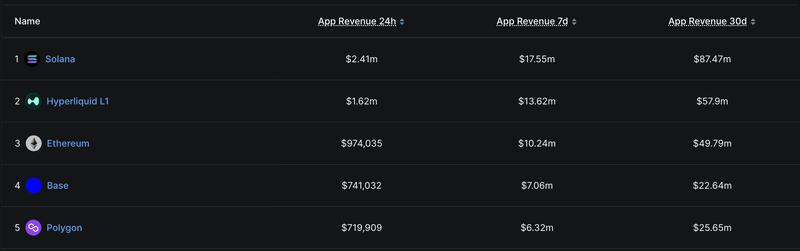
The blockchain directs 99% of its protocol fee revenue to its Assistance Fund, which executes HYPE purchases on the open market. This buyback structure has evolved into a fundamental component of the optimistic investment thesis surrounding the token, since elevated trading volumes can translate into sustained recurring demand for HYPE.
The general environment for perpetual futures contracts has similarly strengthened.
Last Friday, the CFTC acknowledged perpetual futures as valuable instruments for price discovery and risk management, contributing to the legitimization of the market segment central to Hyperliquid's operational framework, despite the protocol not being a direct beneficiary.
HYPE has gained approximately 25% following the CFTC announcement.
The introduction of US-listed HYPE exchange-traded funds (ETF) may additionally contribute fuel to the ongoing rally.
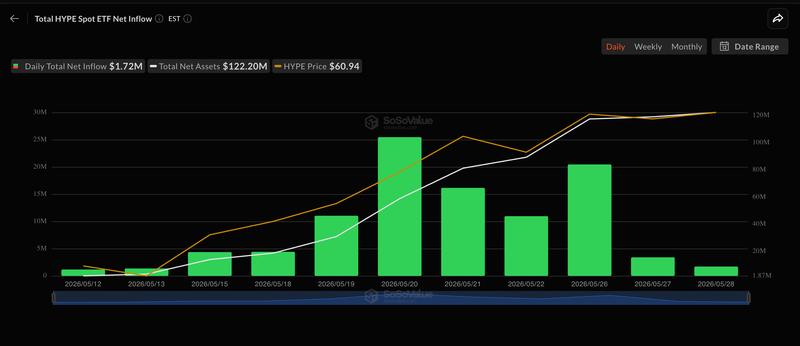
Following their May 12 launch, HYPE investment products from Bitwise and 21Shares have accumulated combined net assets totaling $122.2 million, per SoSoValue data, demonstrating early institutional appetite for the digital token exposure.