
Has Bitcoin Hit Rock Bottom Against Gold? Historical Patterns Point to $167K BTC by 2027
A 40% surge in Bitcoin's value relative to gold suggests a market bottom may be in, mirroring historical patterns that led to significant BTC/USD price increases.
A potential massive upswing for Bitcoin (BTC) could be on the horizon, according to a repeating pattern observed in its performance against gold, suggesting possible gains reaching 180% in the coming 12 months.
Key takeaways:
- Bitcoin has surged approximately 40% against gold since March following a seven-month consecutive decline.
- Past BTC/XAU recovery patterns have frequently aligned with Bitcoin bottoming out when measured in US dollars.
Bitcoin could reach $167,250 in one year
This optimistic indicator emerges from analyzing the Bitcoin-to-gold ratio (BTC/XAU), a metric that measures Bitcoin's value in relation to gold when both are denominated in US dollars. Throughout Bitcoin's history, dramatic upward reversals in this metric have coincided with significant cycle bottoms for the cryptocurrency, typically followed by substantial price appreciation.
Back in 2015, a bottom formation in the BTC/XAU ratio led to approximately 250% gains for Bitcoin over the subsequent year.
Comparable trend reversals observed in 2019 and 2022 were followed by rallies of approximately 140% in each instance. When excluding the extraordinary 1,460% surge in 2020 driven by unprecedented liquidity injections, the historical pattern suggests an average one-year Bitcoin price increase of roughly 180% following BTC/XAU ratio bottoms.
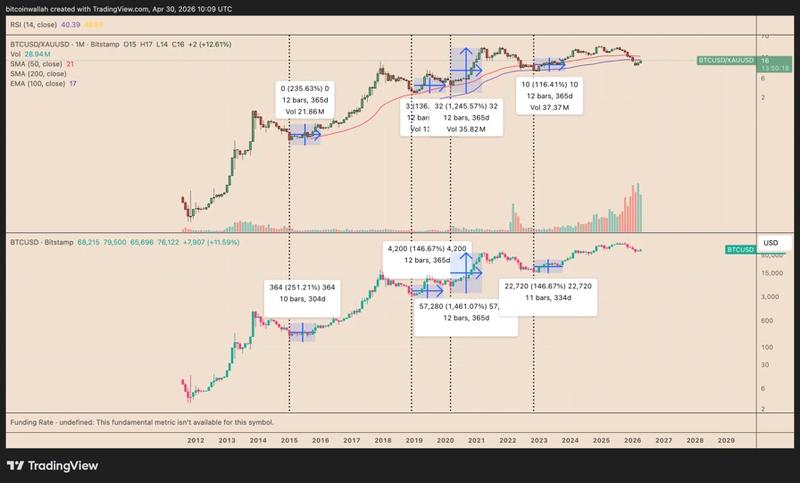
Looking at current data from 2026, the BTC/XAU ratio has experienced an approximately 40% increase from its February bottom. During this identical timeframe, the BTC/USD exchange rate has risen by 32.65%.
"Bitcoin versus gold is about to close a second month in the green after 7 red candles in a row," said Nik Bhatia, founder of macro research firm The Bitcoin Layer, adding that "the bounce is in."
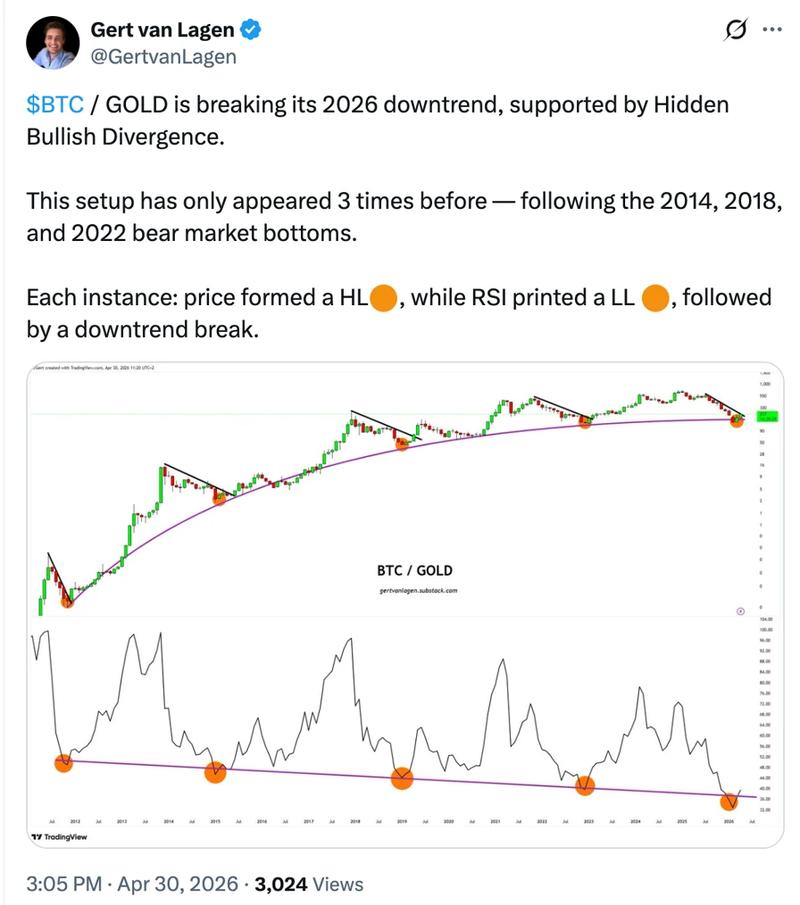
Gert van Lagen, a macro strategist, identified a "hidden bullish divergence" formation that emerged after the bear market lows of 2014, 2018, and 2022.
Additionally, Fidelity Investments noted in their April research report that Bitcoin has transitioned into "an accumulation phase" while simultaneously outperforming gold.
Should the historical cycle pattern of 180% gains repeat itself, Bitcoin's price target would reach $167,250 by April 2027, assuming the February lows in both BTC/USD and BTC/XAU ratios are confirmed as cycle bottoms.
Several market analysts, including Gautam Chhugani from Bernstein, have forecasted that Bitcoin's price will hit the $150,000 level during 2026, with the primary catalyst being potential capital flows rotating out of gold.
Matt Hougan, who serves as chief investment officer at crypto asset manager Bitwise, stated in April that Bitcoin has the potential to surpass gold's $30 trillion market capitalization.
Critical trend line casts doubt on bullish projection
The BTC/XAU ratio continues trading beneath its 100-month exponential moving average (100-month EMA, the purple line), a technical level that has historically signaled significant bottoms, notably in March 2020 and December 2022.
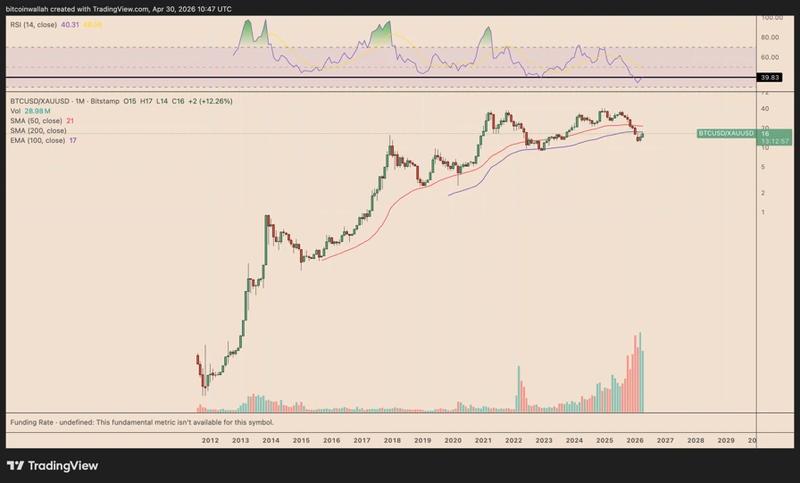
The breakdown below this level in January represented the first definitive breach of this critical support zone. Continuing to trade beneath this threshold presents the risk of trapping bullish traders and potentially postponing Bitcoin's performance recovery relative to gold.
On a shorter timeframe, the BTC/XAU ratio is also encountering resistance from a rising wedge formation visible on the daily chart.
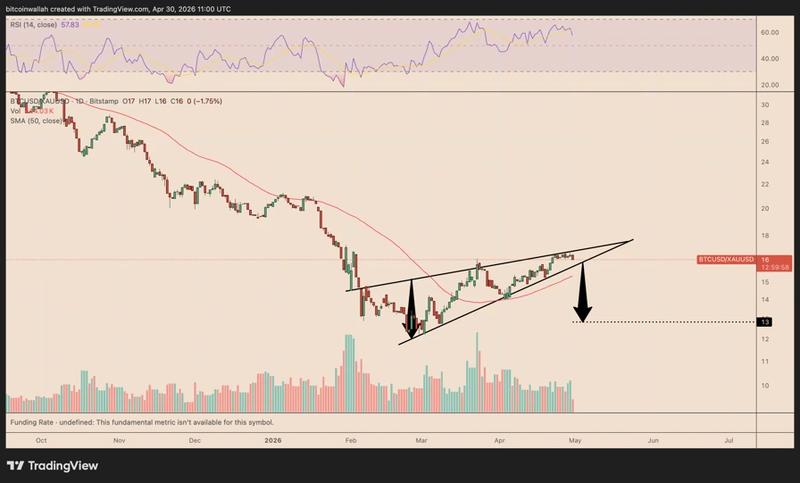
This bearish pattern suggests a possible 20% decline in Bitcoin's value when measured against gold, calculated using the wedge's measured move methodology.
Broader macroeconomic factors, including elevated yields on US bonds and increasing oil prices, could potentially interfere with these historical patterns playing out as expected. According to Cointelegraph's reporting, Bitcoin derivatives markets indicate that traders are exercising caution while the Federal Reserve maintains current interest rates and Bitcoin's price remains in consolidation mode.