
Experts Break Down the Resistance Preventing Bitcoin From Breaking Past $80K
Three primary obstacles—a significant overhead resistance zone, heightened selling from profitable positions, and renewed outflows from Bitcoin ETF products—continue to prevent BTC from surpassing the $80,000 threshold.
Following a drop below $60,000 to multi-year lows, Bitcoin (BTC) staged an impressive 32% recovery rally that pushed prices to a 10-week peak of $79,500 on April 22. However, investors who purchased during the climb capitalized on the upward movement to liquidate their holdings, leading to a pullback to $76,000 by Thursday, as the $80,000 level continues to present a formidable obstacle.
Key takeaways:
- A substantial concentration of sell orders exists near the $80,000 mark, creating a resistance barrier that could impede bullish momentum.
- Persistent selling by short-term investors and holders of Bitcoin ETF shares continues to hamper price recovery efforts.
Why Bitcoin struggles to surpass $80,000
According to previous coverage by Cointelegraph, Bitcoin's attempt to surpass the $80,000 threshold was unsuccessful, with the recovery rally falling short of signaling a definitive bull market resurgence.
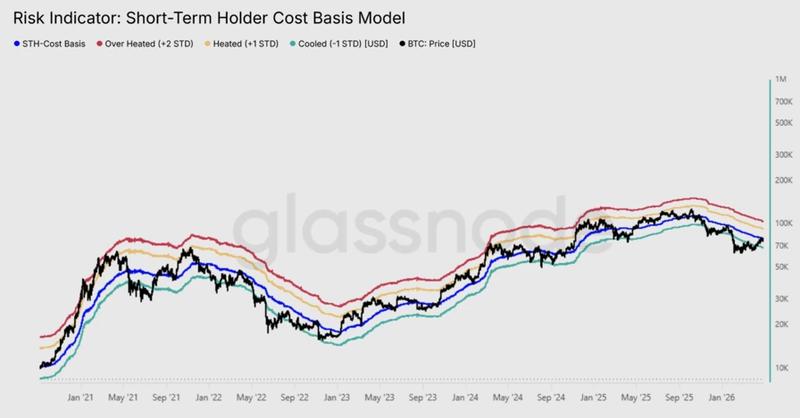
The primary obstacle stems from a resistance area positioned between the True Market Mean at $78,000 and the Short-Term Holder (STH) cost basis at $79,000, which persistently limits upward price action, as investors who recently entered positions leveraged this price range to exit positions close to their entry points.
This behavior is a textbook pattern in bear markets, where price approaches the breakeven level of the most price-sensitive cohort, the incentive to exit positions overwhelms incoming demand, exhausting upside momentum.
Glassnode
With this rejection confirming overhead resistance, the mid-term bias tilts toward further downward pressure.
Glassnode
Analysis of Bitcoin's cost basis distribution reveals that approximately 475,301 BTC are currently held by investors with an average acquisition price ranging from $77,800 to $80,880, highlighting the critical nature of this resistance area.
Market analysts indicate that for the BTC/USD trading pair to advance toward higher price levels around $84,000, it must successfully convert the resistance at $80,000 into a support level.
Following the recapture of both the 50-day and 100-day simple moving averages, the BTC/USD pair has been displaying "one bottoming signal after another firing on higher timeframes," according to technical analyst SuperBitcoinBro in a Wednesday post on X, who further noted:
But I agree it needs to get past 80K.
SuperBitcoinBro
Market commentator Daan Crypto Trades emphasized that the $80,000 price point represents the "main level for the bulls in the short/mid term."
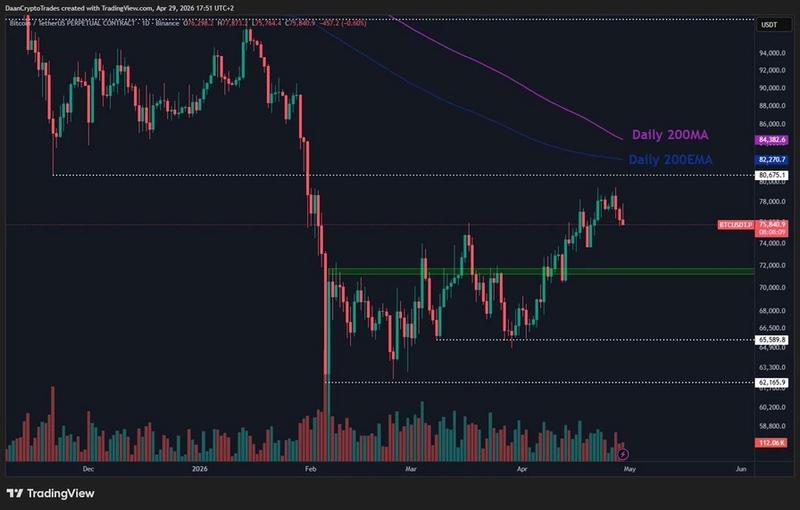
According to prior reporting by Cointelegraph, a decisive break above the $80,000 level by Bitcoin would demonstrate that bullish forces maintain market control, potentially opening the path toward the subsequent major resistance barrier at $84,000.
Short-term holder selling activity disrupts upward momentum
Further onchain analysis reveals "heavy distribution" occurring among short-term holders, as these market participants locked in gains during Bitcoin's recent climb toward $80,000.
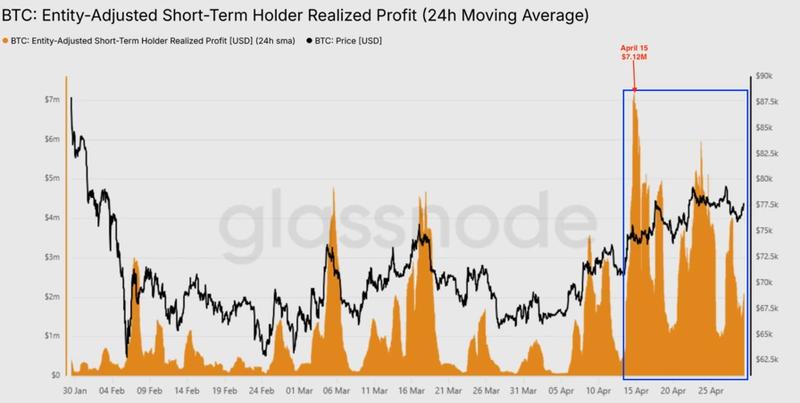
Data from the 24-hour SMA of STH Realized Profit indicates that as Bitcoin's price neared the $80,000 threshold, recent buyers were realizing profits at an hourly rate of $4 million.
This metric, which tracks the 24-hour SMA of STH Realized Profit, serves as a real-time indicator measuring the intensity with which recent purchasers are crystallizing their gains.
The indicator surged to as high as $7.2 million per hour on April 15, representing approximately "four times the base level that had established itself since mid-April, confirming that short-term holders seized the rally as a distribution opportunity," according to Glassnode, which further stated:
The buy side simply lacked sufficient liquidity to absorb this wave of profit realization, capping momentum and triggering the subsequent rejection.
Glassnode
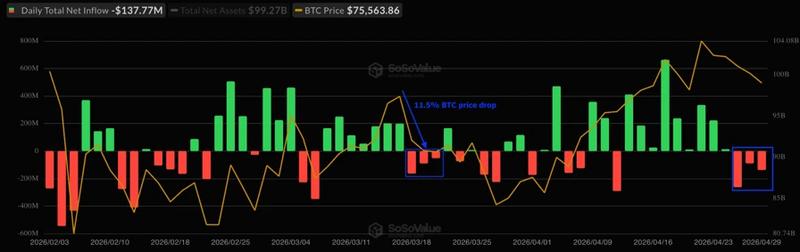
Additional downward pressure originated from US spot Bitcoin exchange-traded funds, which experienced outflows over three consecutive trading sessions, accumulating a total of $390 million in withdrawals.
These consecutive outflows represent the longest sustained withdrawal period since March 20, when a three-day streak of outflows coincided with an 11.5% decline in BTC price following a rejection at the $76,000 level.
Market analysts at Wise Advise noted that the resumption of outflows from spot BTC ETF products following a nine-day period of continuous inflows represents an initial indication that "the local top may be in."