Ethereum's Key Valuation Indicator Reaches Lowest Point Since 2022: Could $2.5K Be Next?
An uncommon signal from a critical Ether price metric indicates the cryptocurrency is trading below fair value, as growing interest in spot and derivatives markets points toward a potential surge to $2,500.

Ethereum's native token Ether (ETH) could be positioning itself for a move toward retesting the $2,500 level, provided the ongoing upward momentum above $2,150 continues alongside the constructive spot and futures market activity that has been driving prices upward.
The second-largest cryptocurrency is receiving additional backing from a crucial macroeconomic metric that positions the digital asset within an uncommon undervaluation territory last observed in 2022. These signals point toward diminishing sell-side pressure and indicate the initial phases of an accumulation cycle for Ethereum.
Ether price formation gains strength beyond $2,150
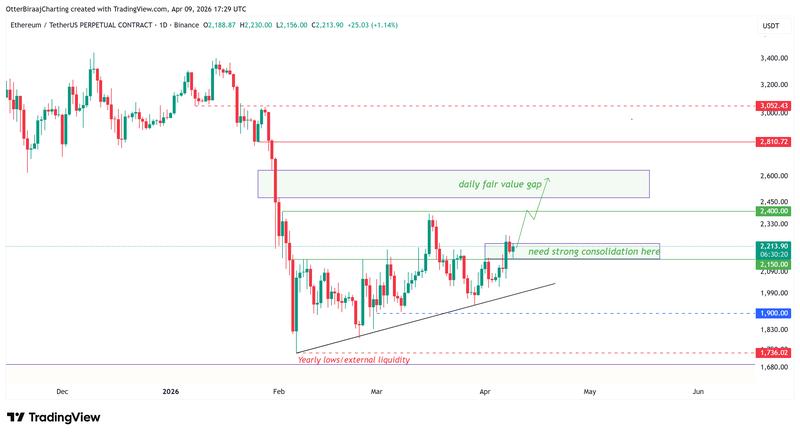
The daily price chart for Ether reveals that buyers are taking control following a 6.33% upward movement that propelled the asset above the $2,150 resistance threshold. ETH is currently targeting a potential retest of its March peak levels around $2,385, with additional bullish potential extending toward the $2,475–$2,635 fair-value gap that serves as a price attraction zone for buyers.
Multiple retests of the $2,150 level throughout the previous two months indicate deteriorating resistance strength, as purchasing activity continues to emerge at progressively higher price points.
Technical analysis reveals that ETH's market structure is experiencing improvement, with the present trading volumes being predominantly driven by spot market activity. Examining the four-hour timeframe, ETH continues to establish higher lows as it works toward penetrating the $2,250–$2,300 price zone.
The combined spot cumulative volume delta (CVD) has sustained elevated levels during April, reaching 184,500 ETH, which demonstrates consistent demand in the spot markets.
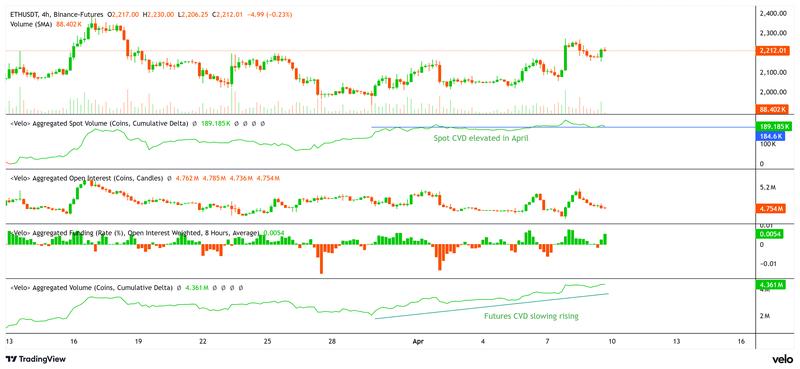
The futures cumulative volume delta has similarly experienced a gradual upward trajectory, climbing to 4.36 million ETH, which suggests that participants in the derivatives market are starting to provide support for the movement rather than driving it independently.
The current funding rate stands at a positive 0.0052, demonstrating a bias toward long positions, while the open interest hovering near 4.75 million ETH continues to remain within a defined range, pointing to constrained leverage in the market.
Market data indicates that ETH is experiencing a measured accumulation phase, with spot demand taking a slight lead, although a more powerful breakout would probably necessitate an increase in futures market positioning.
Macroeconomic indicator places ETH within an "uncommon" undervalued territory
Ethereum may be approaching a macroeconomic bottom based on the Capriole Macro Index Oscillator, which currently displays a reading of -2.42. This measurement positions Ether within an uncommon undervalued zone that has historically been associated with capitulation events and trend reversals.
This analytical tool monitors investment patterns, cycle positioning, and onchain metrics, with significantly negative readings typically indicating seller exhaustion.
Historical signals demonstrate the indicator's accuracy. During the June to July 2022 period, ETH reached its bottom near the $1,000–$1,200 range when the oscillator descended to -2.2. Throughout October to November 2023, a decline to -1 coincided with ETH's price breakthrough following a descent to $1,500.
During April 2025, another negative measurement identified a local bottom in the vicinity of $1,500, establishing the foundation for an upward movement surpassing $4,000.
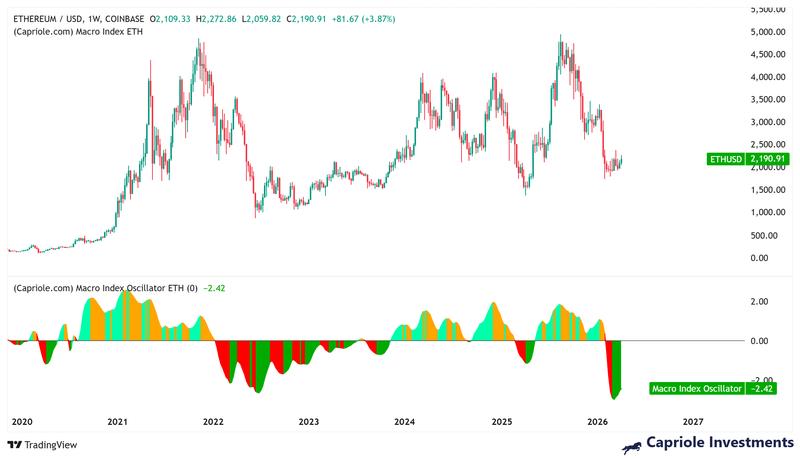
The present market configuration bears resemblance to previous capitulation episodes. ETH has experienced a decline from peak levels around $4,800 down to $2,100, while the oscillator reading remains positioned near cycle lows.
Given that ETH now occupies an uncommon undervalued zone, the potential for downside risk seems constrained compared to the upside opportunity. Nevertheless, validation would arrive with a successful recapture of the $2,400–$2,500 price level accompanied by the macro indicator's movement back toward the zero threshold.
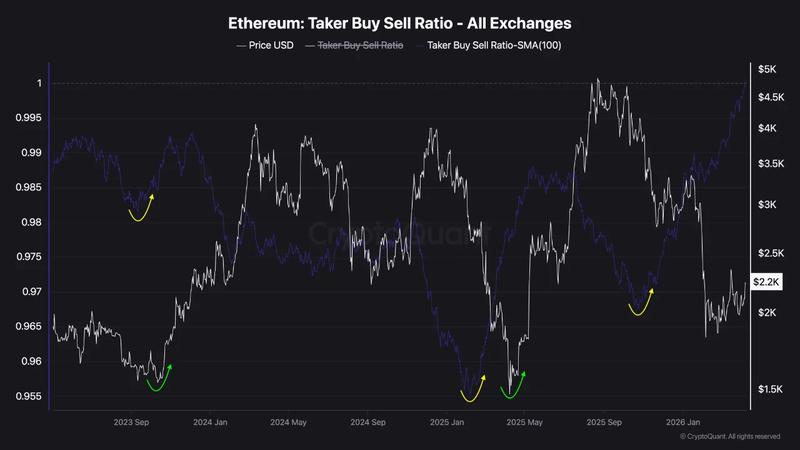
Market analyst crypto sunmoon observed that the ETH taker buy/sell ratio has maintained an upward trajectory spanning four to five months.
When considered alongside the current price drawdown, the technical structure bears resemblance to the configuration that preceded the April to May 2025 upward movement, indicating that a comparable recovery phase could be developing.