
Data Suggests Bitcoin Recovery Could Be Pushed to 2027 if Price Drops Under $60K
The timeline for Bitcoin to reach new all-time highs is directly correlated with the severity of the ongoing market correction, with historical data indicating that deeper price drops result in significantly extended recovery periods for BTC.

The leading cryptocurrency Bitcoin (BTC) has erased its entire gains from March, showing a decline of 1.40% for the month and experiencing a significant 24.6% loss throughout the first quarter of 2026. The long-term trajectory of Bitcoin is consistent with an extensive drawdown phase for BTC, potentially lasting through the final months of 2026, with numerous market analysts forecasting an additional 40% price decline.
Under such circumstances, Bitcoin's path to recovery could be delayed until the second quarter of 2027, given that more substantial BTC price corrections historically require considerably more time for full recuperation.
Correlation between Bitcoin drawdown severity and recovery timeframe
Analysis from Ecoinometrics reveals a distinct correlation between how far Bitcoin drops and how long it takes to recover. Historical patterns demonstrate that for every additional 10% decrease in price, approximately 80 days are added to the period necessary for Bitcoin to recapture its previous peak values.
Based on the present 48% drawdown from all-time highs, the complete recovery timeline is projected to span approximately 300 days measured from the October 2025 peak of $126,000.
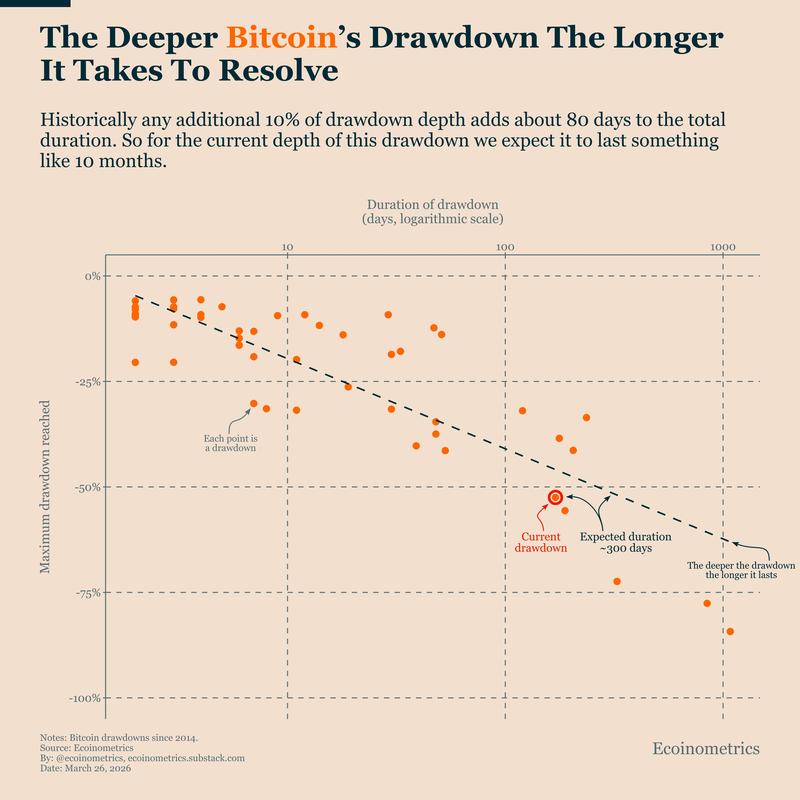
As of now, approximately 172 days have elapsed since the peak, which would leave around 125 to 130 days remaining if the bottom of this cycle has already been established at $60,000. Nevertheless, there remains uncertainty about whether the cycle lows have truly been reached, with BTC facing the possibility of additional downward pressure in the upcoming weeks.
The Bitcoin Combined Market Index (BCMI), a composite metric incorporating market-value to realized-value (MVRV), net unrealized profit/loss (NUPL), spent output profit ratio (SOPR) and overall market sentiment, presently registers at approximately 0.27.
This reading remains significantly higher than the 0.15 level that has historically signaled cycle bottoms during all major downturns beginning in 2018.
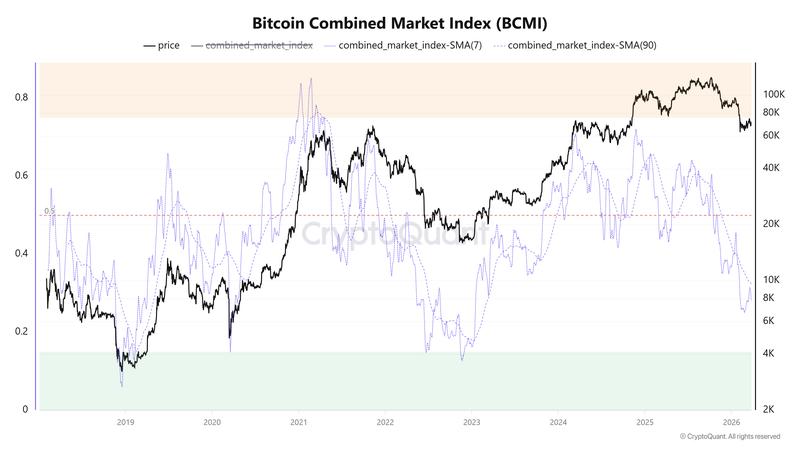
During the 2018 market cycle, the BCMI indicator touched 0.15 when Bitcoin declined to $3,100 after reaching its $20,000 all-time high. The year 2020 saw the index plunge to 0.147 at a price point of $5,100. Likewise, during November 2022, the BCMI indicator descended to 0.12 coinciding with BTC establishing its cycle bottom at $15,880.
Given that the index remains well above these historical bottom territory readings, a decline toward 0.15 during 2026 would likely necessitate further price depreciation for BTC. This potential development is compatible with a more severe capitulation event for BTC, mirroring the pattern of previous cycle resets.
Lower BTC price levels push recovery timeline into Q2 2027
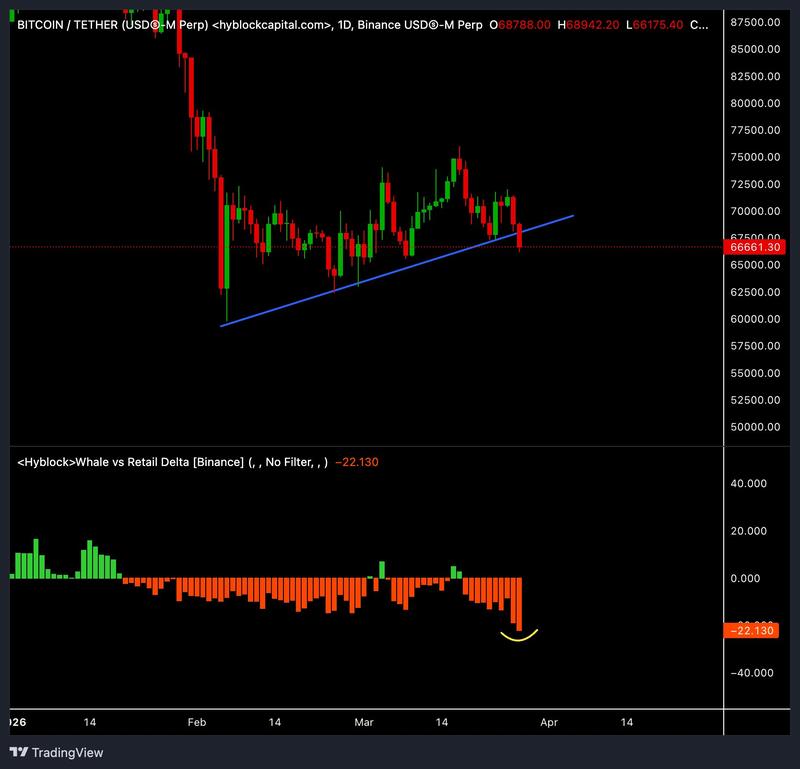
Cryptocurrency analyst Ardi observed that the difference between whale delta and retail delta hit its most extreme sell reading at -22.13 since October 2024. The analytical chart displays the BTC price declining below an ascending trendline, concurrent with persistent distribution patterns from major market participants. Ardi said,
"Larger players are selling into this structure harder than they have in 18 months. That does not mean price has to collapse immediately. But it does mean this level is being tested with real sell pressure pressing into it."
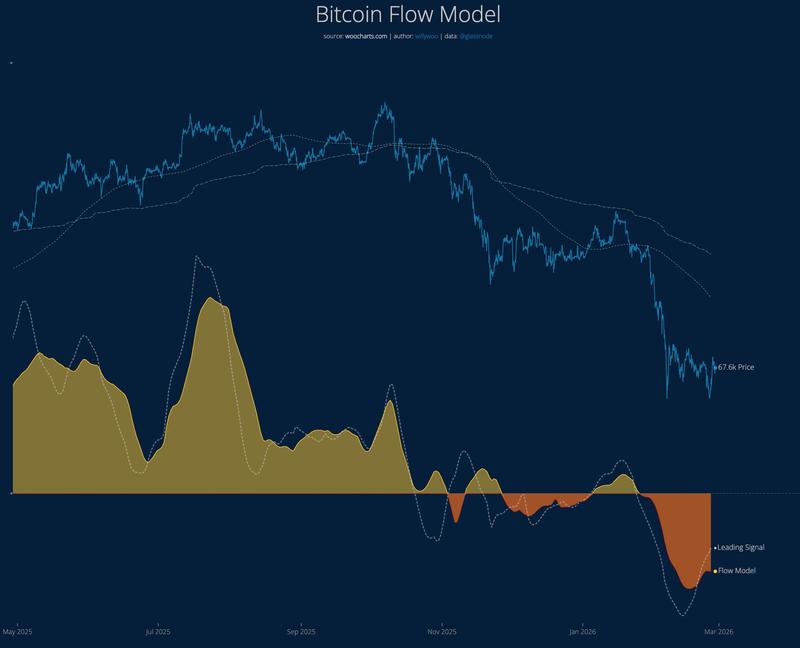
From the perspective of market liquidity, CMCC Crest managing partner Willy Woo described comparable vulnerability in BTC's price action. Woo successfully predicted during the previous month that BTC would experience a recovery into the mid-$70,000 territory throughout March, before conforming to the downtrend because "the broader regime is heavily bearish with both spot and futures liquidity deteriorating."
Looking at the broader cycle dynamics, Woo anticipates a more substantial reset before a definitive bottom can be confirmed. Woo has pinpointed the $40,000–$45,000 price range as a characteristic bear market support level, with the timing for the conclusion of the bearish phase leaning toward Q4.
This analytical framework positions the emergence of renewed bullish momentum during the early months of 2027.
Should Bitcoin continue its descent into the $40,000–$45,000 price zone, the correction from the $126,000 all-time high would intensify to approximately 64–68% below peak levels. According to the Ecoinometrics' analytical framework, this magnitude of additional decline would substantially extend the recovery duration.
When experiencing a drawdown exceeding 60%, the total duration required for full recovery has historically lengthened to approximately 440 days measured from the cycle's highest point. Under this scenario, a potential reclamation of the previous all-time high would be anticipated to occur at some point following Q2 2027.
It is important to note that these timelines are based on historical drawdown patterns and do not represent predictions. The current macroeconomic conditions may alter that recovery path as well.
The Kobeissi Letter noted that the rate cuts are now expected only by December 2027, with a 51% chance of a rate hike by March 2027. This unexpected development may impact Bitcoin's recovery pace relative to past cycles.
This article does not contain investment advice or recommendations. Every investment and trading move involves risk, and readers should conduct their own research when making a decision.