
Data Analysis Reveals: Are Long-Term Ethereum Holders Exiting Their Positions?
Following the latest market downturn, veteran Ethereum whales have withdrawn millions in capital, raising concerns about additional downside pressure on ETH.

A veteran Ether (ETH) holder liquidated their position during the previous week while prices approached the $2,000 threshold, triggering concerns about additional downward momentum. Nevertheless, blockchain analytics present an alternative narrative as market participants attempt to identify where ETH/USD could find a bottom.
Key takeaways:
- A veteran Ethereum whale liquidated $136 million worth of ETH, intensifying downward pressure while Ether remains beneath the $2,000 threshold.
- Blockchain analytics demonstrate no indication that veteran ETH holders are conducting widespread liquidations.
- Market experts caution the ETH valuation may decline further approaching the $1,500 support zone.
Veteran Ethereum whale liquidates $136 million in ETH
A long-standing Ethereum whale, representing an original investor who has maintained tokens since the blockchain's earliest days, liquidated 55,000 ETH valued at approximately $112.25 million along with 9,442 ETH worth around $24 million during the previous week.
The veteran Ether holder disposed of a total $136 million at a mean price of $2,041 per ETH, as reported by blockchain analytics platform Lookonchain.
Nevertheless, this appears to represent an isolated incident rather than a broader movement, since an examination of Ethereum's distribution, utilizing "HODL waves" methodology, demonstrates that a substantial portion of Ethereum's circulating supply has remained stationary across different timeframes. Actually, the percentage held by longer-term investor groups has typically expanded throughout the previous year.
In the more recent period, the 3m-6m holder group experienced a significant decrease in supply, declining to 9% from 13.5% recorded on May 19. The 1w-1m holder segment has similarly witnessed its supply holdings decrease to 2.6% from 4.76% during the identical timeframe. This indicates that the majority of supply movement is occurring among short-term participants.
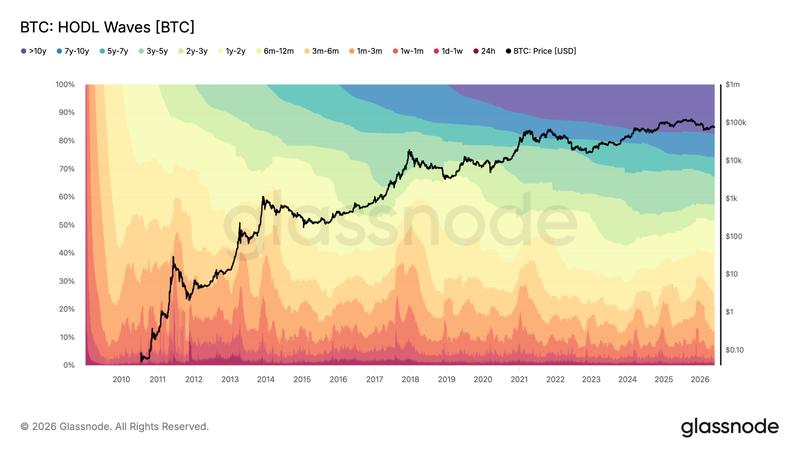
Actually, the supply controlled by the 5y-7y holder group has risen marginally to 9% from 8.59% recorded on May 19.
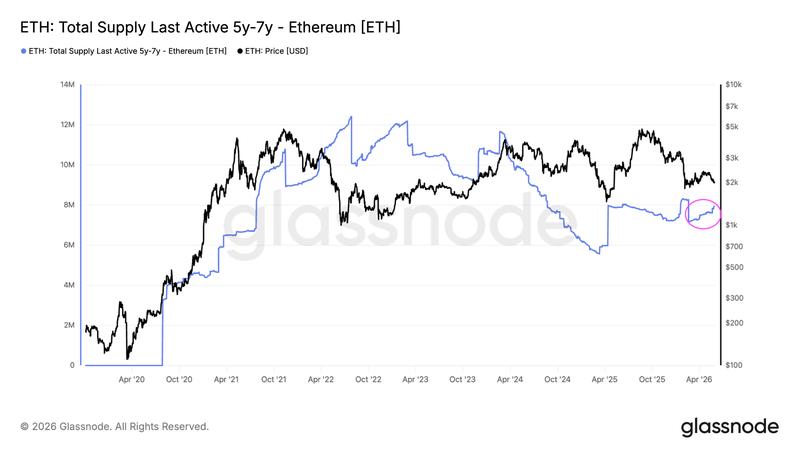
Additionally, the analysis below demonstrates that the supply with last movement 5-7 years in the past has experienced only a minor increase in recent weeks and remains significantly below the levels observed in 2022 when ETH valuation reached a bottom under $1,000.
Apart from multiple notable entities declaring that they have liquidated portions or complete ETH positions in recent times, there exists no authentic widespread pattern supporting the notion that original Ethereum investors are conducting mass liquidations.
Could Ether price decline to $1,500?
Beginning Thursday, ETH/USD has been fluctuating near the $2,000 psychological threshold while market participants prepared for additional downward movement.
Currently, ETH is exchanging hands at $1,980, representing a 2% decline during the past 24 hours and 6.5% decrease for the week.
"This doesn't look good for Ethereum," analyst Alex Marzell said in an X post on Sunday adding:
Momentum continues to favor the bears as $ETH moves closer to the next key support area.
Marzell was pointing to the critical support zone around $1,800, which market experts indicate must remain intact to prevent a more substantial correction.
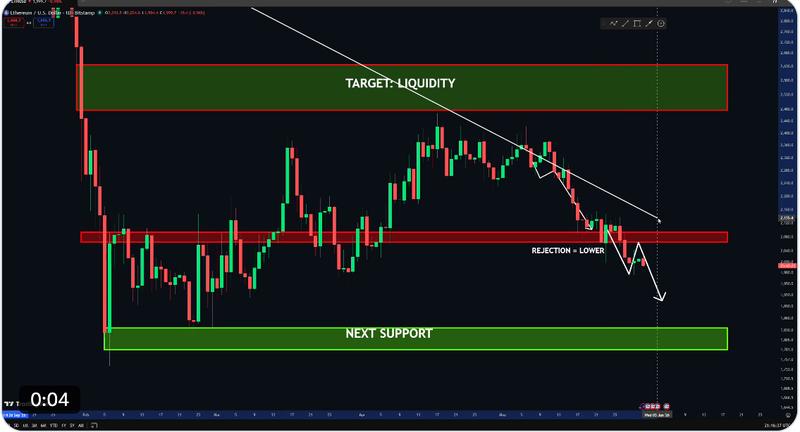
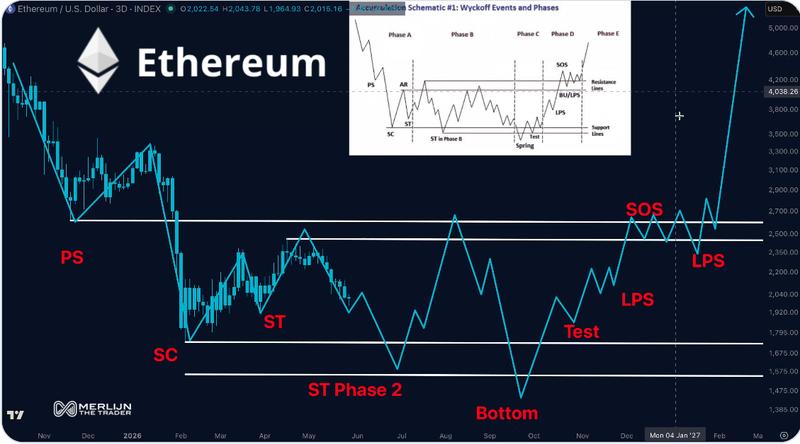
Analyst Merlijn The Trader stated that the ETH/USD price movement is "mapping perfectly onto a Wyckoff Accumulation structure," as illustrated on the three-day chart below.
The market expert elaborated that ETH is presently in a "Phase B consolidation, post-selling climax" and was transitioning into Phase C, during which it would establish a bottom beneath $1,500.
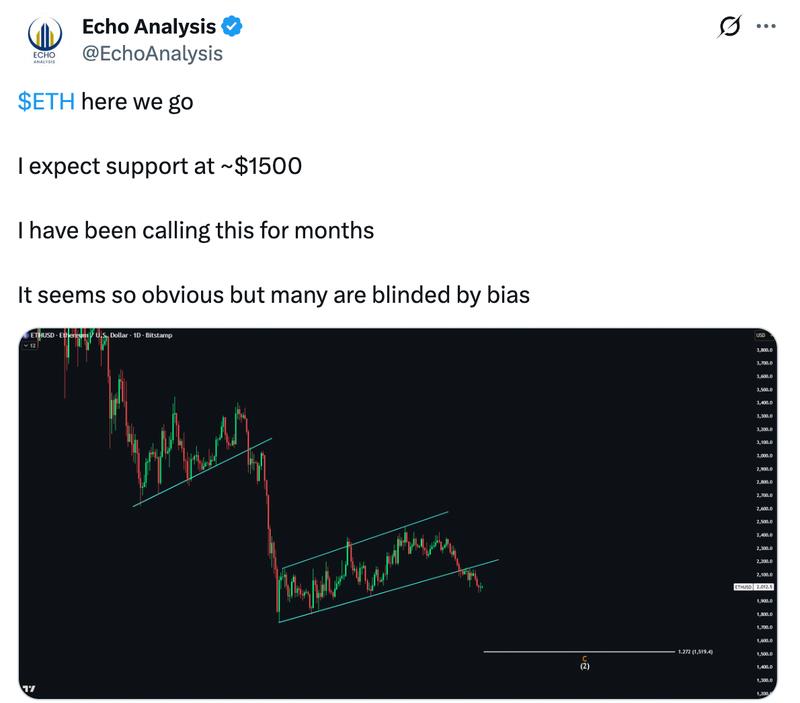
An additional technical assessment by Echo Analysis indicated a bear flag breakdown pattern projected ETH price decline approaching $1,500 support.
As Cointelegraph reported, escalating supply on exchanges and diminishing ETF demand put ETH at risk of another leg down toward the $1,500-$1,700 demand zone.