
BTC targets $90K milestone as rare bullish divergence pattern emerges once more
A rare weekly bullish divergence appears in Bitcoin for just the second time in history, the same technical signal that led to a massive 755% surge in BTC valuation.

Bitcoin (BTC) is currently displaying an uncommon pattern where declining prices contrast with strengthening momentum indicators, a technical formation last witnessed during the market lows surrounding the FTX collapse.
Key takeaways:
- A historically rare weekly bullish divergence pattern in Bitcoin, only the second ever recorded, suggests potential movement toward $90,000.
- The digital asset is maintaining support near its 200-week SMA, a technical level that previously served as a bottom formation during bear markets in 2015, 2018 and 2020.
Previous bullish divergence triggered a massive 755% price surge
By Monday's trading session, BTC's weekly relative strength index (RSI) had climbed above 34, approximately two weeks following its dip beneath the oversold level of 30. During this identical timeframe, Bitcoin's price declined to approximately $63,000 after trading at $75,770.
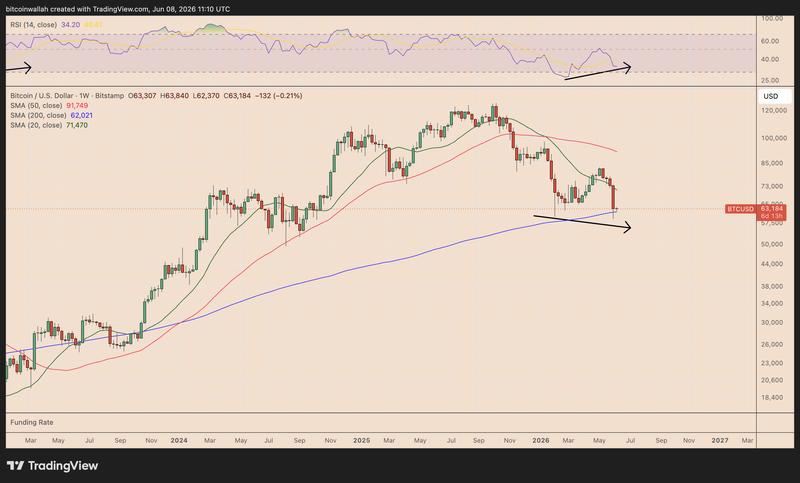
While Bitcoin continues to establish lower price points, indicating ongoing seller activity in the market, its RSI metric has stopped declining in tandem with price action. The momentum indicator has instead bounced back from oversold conditions and is currently establishing a higher low formation.
Within technical analysis frameworks, this pattern is identified as a bullish divergence. This occurs when price action continues its downward trajectory while the underlying momentum indicators begin showing improvement. Such configurations frequently indicate that selling pressure is beginning to weaken prior to price action confirming a reversal.
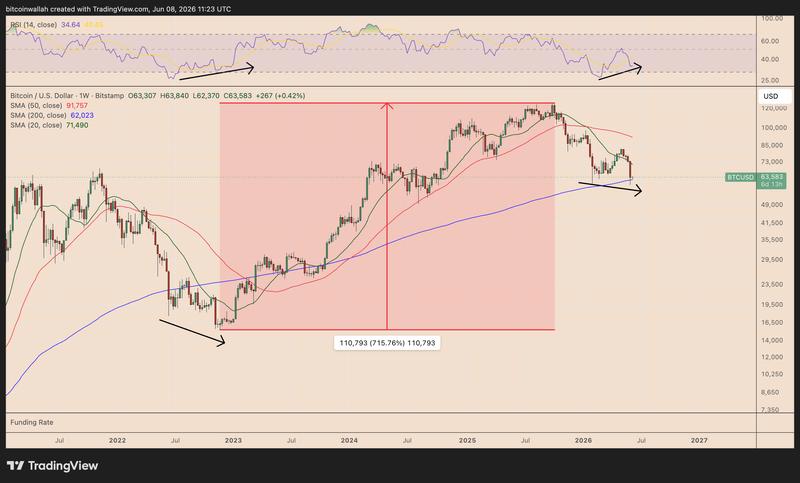
Should this divergence receive confirmation this week, it would represent just the second occurrence of this signal on Bitcoin's weekly timeframe. The initial instance emerged following the FTX exchange collapse in November 2022, which preceded a 715% surge from approximately $15,500 to an all-time high approaching $126,200.
This historical context brings Bitcoin's nearby resistance levels into sharper focus. The initial significant target sits at the 50-week simple moving average (50-week SMA, red line) positioned around $91,755, a level that typically functions as dynamic resistance throughout recovery phases.
BTC maintains support at historical bottom formation near $62,000
The case for bullish momentum receives additional reinforcement from the location where this divergence pattern is developing.
Bitcoin is maintaining its position near the 200-week SMA (blue line), presently situated around $62,000. This technical indicator has historically functioned as a bottom formation at the conclusion of bear markets in 2015, 2018, and 2020.
Market analyst Michael van de Poppe identified the 200-week SMA as an "ideal area to accumulate," though he emphasized that bulls need to overcome the $64,000-65,000 range to achieve additional bullish validation.
If that breaks, there's nothing stopping Bitcoin from running all the way towards $71,500-73,000 and potentially even as high as the CME gap at $79,000.
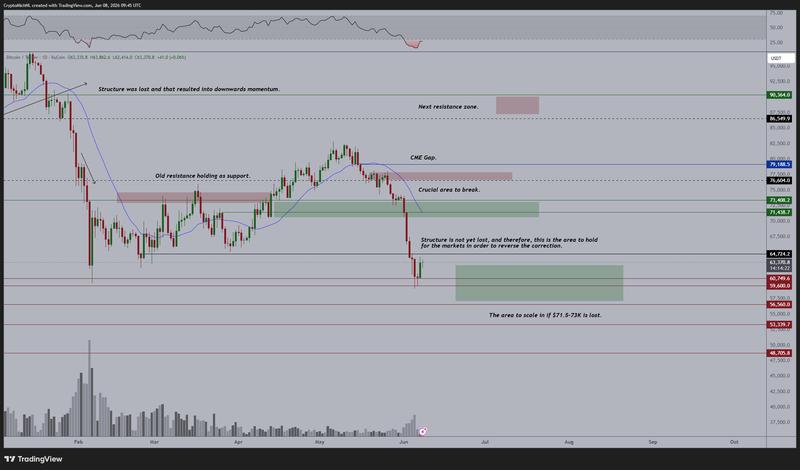
Within the same technical analysis, Van de Poppe identified the region above $90,000 as the "next resistance zone," which corresponds with the previously mentioned 50-week SMA target level.
Bear flag pattern maintains $50,000 downside target possibility
While Bitcoin's bullish divergence pattern takes shape, BTC has already entered the breakdown phase of a weekly bear flag formation, which keeps downside risk scenarios in play.
Bear flag patterns develop when price action rallies within an ascending parallel channel structure following a steep decline, before ultimately breaking downward once more. Bitcoin has now fallen beneath this channel formation, mirroring its breakdown from the symmetrical triangle consolidation pattern observed in 2022.
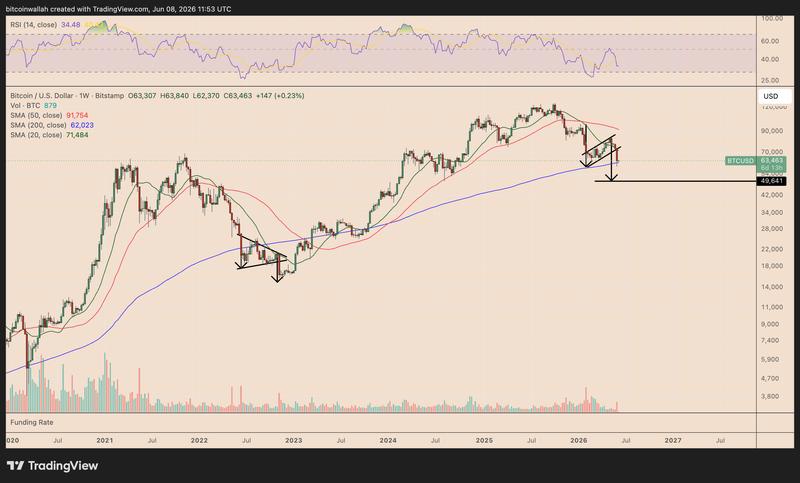
Should the pattern fully materialize, BTC faces potential downside risk toward the bear flag's measured target located below $50,000. This target level would continue to remain relevant unless Bitcoin successfully recaptures the flag's lower trend line and establishes it as support once again.