BTC Surges to $83.3K Amid Strong Q3 Corporate Results and Oil Price Decline
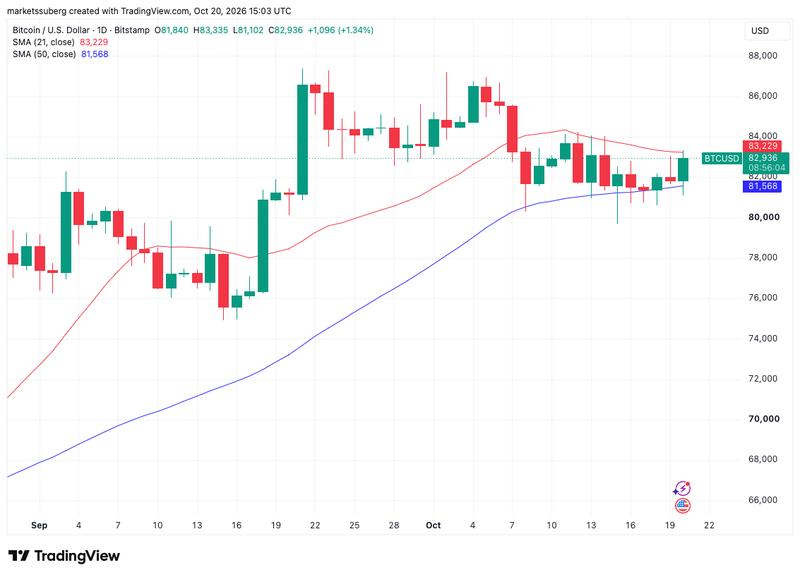
Strong corporate earnings from Q3 propelled equity markets higher while Bitcoin climbed to $83,300, encountering resistance at the 21-day moving average.

Following the opening bell on Wall Street Tuesday, Bitcoin (BTC) climbed back above the $83,000 threshold as equity markets rallied on the strength of positive corporate earnings releases.
Key points:
- Supported by better-than-anticipated Q3 corporate earnings, Bitcoin posted gains of as much as 1.5%, mirroring the upward momentum in American equities.
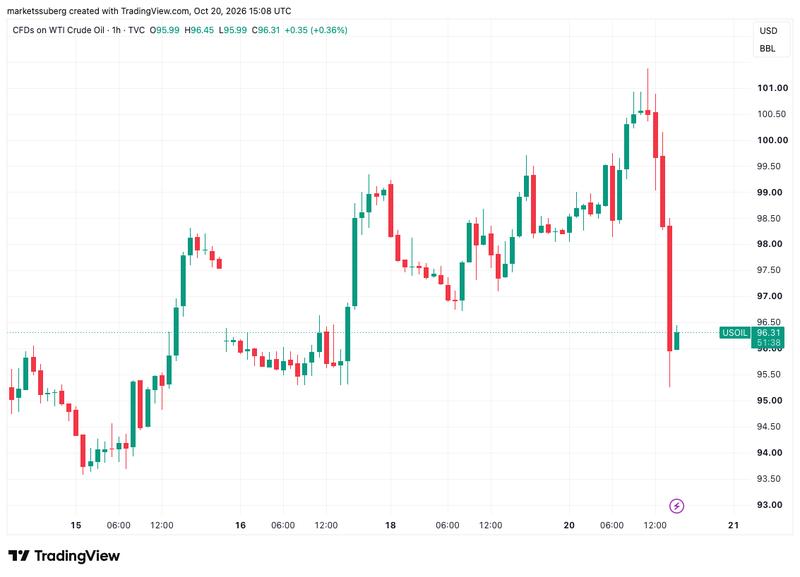
- After touching $101 per barrel in early Tuesday trading, crude oil prices plummeted close to 5% within hours as stock markets rallied.
- The 21-day simple moving average (SMA) positioned at $83,230 presented a challenge for BTC price movements.
BTC price swings as US earnings, oil moves drive markets
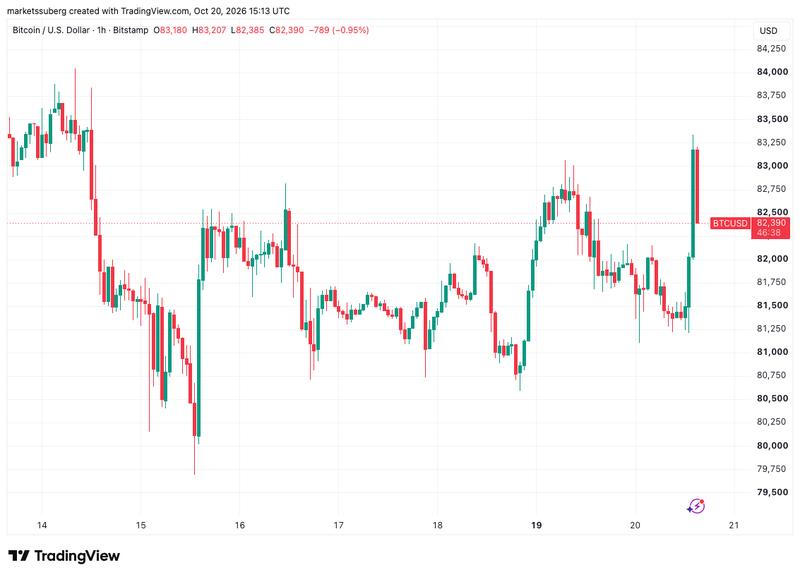
According to data from TradingView, BTC/USD climbed 1.5% to achieve its peak levels since Oct. 14 before pulling back in the direction of $82,000.
Digital currencies participated in the rally alongside American stock indexes as third-quarter earnings releases exceeded forecasts. General Motors and diversified industrial giant 3M both surpassed earnings projections, with 3M additionally raising its full-year profit outlook.
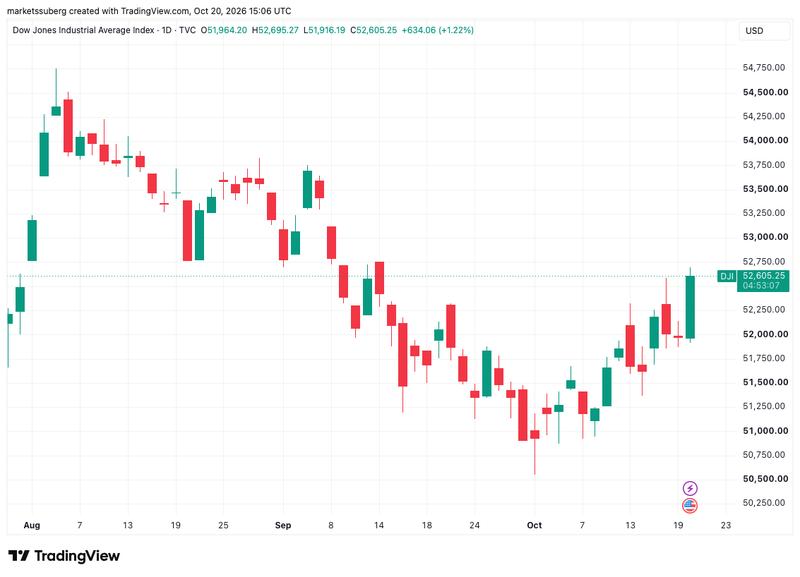
Propelled by these positive results, the Dow Jones Industrial Average climbed 1.2% to reach territory not visited since Sept. 14. Concurrently, the S&P 500 and the technology-focused Nasdaq Composite Index posted gains of 0.6% and 0.5% respectively as of publication time.
The positive earnings reports helped offset concerns stemming from an earlier surge in oil prices during the session, which pushed US WTI crude above the $100 per barrel threshold for the first time since Sept. 17. Nevertheless, WTI experienced a steep decline at the commencement of US equity trading hours, falling to levels beneath $96.
Jose Torres, senior economist at Interactive Brokers, had already identified signs of market relief in a Monday note, following the previous week's technology-sector selloff that eventually impacted US markets by the close of Friday's session.
Improving moods regarding the prospects of modern technology have Wall Street breathing a sigh of relief as participants drop hedges, after the cost of volatility protection soared intraday on Friday, ahead of the intensifying selloff.
Market participants await SpaceX's Q3 earnings report scheduled for release following Tuesday's market close, while Tesla and Meta are both slated to announce results on Wednesday.
Bitcoin rejected at 21-day moving average
According to data from CoinGlass, Bitcoin's advance to $83,000 pushed through a concentration of ask liquidity in the vicinity. The cryptocurrency markets witnessed $125 million worth of short position liquidations during the hour spanning 10 a.m. to 11 a.m. ET.
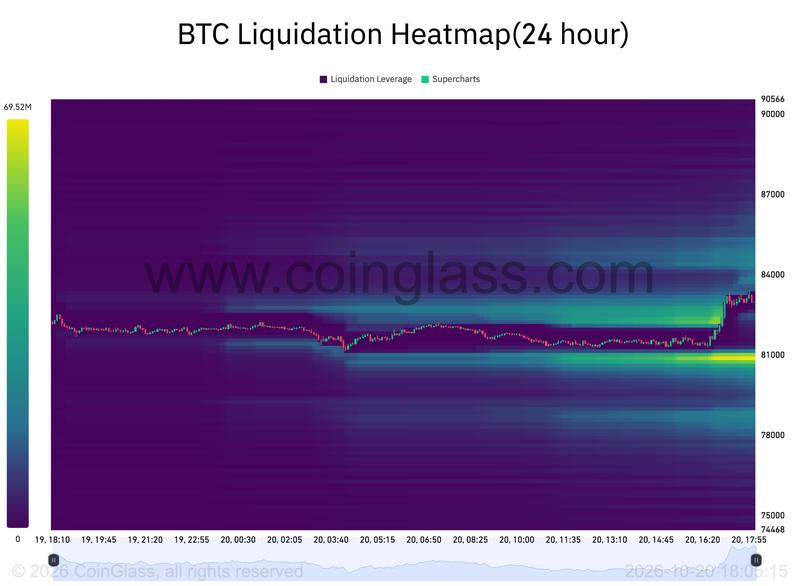
Simultaneously, aggregate open interest across exchanges reached its most elevated level since Oct. 8, climbing to $53.86 billion and representing an approximate 2.1% increase over the preceding 24-hour period.
In his latest technical assessment, Keith Alan, cofounder of cryptocurrency trading platform Material Indicators, contended that maintaining support at the 50-day SMA located at $81,570 would serve as a crucial signal of underlying demand strength.
So far, repeated defenses of the 50-Day show that buyers are still protecting this range.
Alan highlighted that the 21-day SMA positioned at $83,230 was currently functioning as resistance on lower timeframes.